The whole picture in one window
Trade Model Indicator
You stay on one timeframe — 4H, for example — and read the picture from all the others on it: higher-timeframe direction and imbalances, lower-timeframe structure breaks and untested order-flow zones. No chart switching — and no way to keep track of all that by eye. The indicator does not find trade ideas for you.
Educational content — not individual investment advice. Trading involves risk of loss.
The indicator is the one thing we sell. The market analysis we publish openly.

The working chart with Trade Model markup on
One window
One working chart — the picture from every timeframe
The same frame as in the header, with the details called out. It reads as a sequence: an impulse from the swing high to the swing low, a correction up, and structure-break levels from lower timeframes at the end of it. All on a single weekly chart. The numbers were added to the frame by us: the indicator itself does not draw them.

- 1The higher-timeframe direction panel, in the corner of the same chart: W, M and 3M, all three reading SHORT.
- 2The structure zigzag: the LH swing high at the top left and the LL swing low at the bottom, joined by the impulse line.
- 3Order-flow zones in both states: the lilac ones labelled OF are fresh, the grey ones labelled OF tested are the ones price has already tested. The indicator switches that state itself.
- 4Higher-timeframe imbalances labelled with their own TF. On this frame they are all monthly, M FVG, and all grey: price has already gone through them.
- 5Structure breaks from lower timeframes: two levels on the right, each labelled with its own TF. The solid choch 1h is a break that has happened, the dashed choch 4h one is only forming.
Step by step
How an idea comes together
One situation on EURUSD, walked through in the order a chart is actually read. Every markup element is explained where it is needed. Steps 1–3 are one and the same moment on two timeframes, weekly and hourly; step 4 is the same story two months further on. The frames were shot with history playback on, which is why the playback icon is visible in the corner.
Step 1
Higher timeframe: the range and the order-flow zones
The walkthrough starts at the higher timeframe. On the weekly chart the market is going down and is pulling back up right now. The blue line marks the move, the orange dashed one the pullback.
Along the way the indicator marks order-flow zones — the places the market left with a sharp move. Price has not tested the lilac ones yet, the grey ones are labelled OF tested. The indicator switches that state itself.
An untested zone counts as the strong one. The interest that built it has not been spent. By the logic of the method a reaction on the approach is likelier than at one already worked through.

Step 2
The confirmation: the hourly structure breaks
The same moment up close, on the hourly chart. Price reached the order-flow zone, the zone held — the correction was over.
The turn shows in the colour of the labels. While the structure was rising they were green. The drop took out the last support of that rise, and the labels turned red. That is the confirmation of the weekly idea.
The level of that support is the one labelled choch 1h on the weekly frame. The label is not here — the indicator draws it only on a higher chart. The panel says the same: 1H is already SHORT, 4H and D are still LONG.
Step 3
The idea comes together
The two previous steps add up to a finished idea.
Point A is the end of the correction. It is confirmed by the lower-timeframe structure break standing right there by the price.
The place adds weight to the conclusion. A break next to an untested order-flow zone reads with more confidence than a break on its own. A break without the zone is just a break; a zone without the break is just a zone.
Point B is the lower boundary of the weekly range. That is the side the move is turned towards.
Both points are the trader's own reading of what the indicator has shown. The indicator itself does not draw them.

Points A and B were added to the frame by this page — the indicator does not draw them.
- AThe end of the correction — the top of the orange leg. The confirmation is right next to it on the same frame: the solid choch 1h level.
- BWhere the move is turned: out of the weekly range, towards its lower boundary — the level of the LL swing low. The level is not calculated by the indicator and is not a recommendation.

Step 4
What comes next: the ranges follow the idea
The direction is set — down. From here the indicator marks local ranges, and the ones that belong to the idea are the ones pointing its way: eight in a row here. No more guessing whether the move is up or down.
A local break does not cancel the idea: one green label among the red. The high after it came in lower, and the move went on down.
The criterion: the idea holds while point A is not taken out and point B is not reached. Neither has happened — it is still in progress.
The panel says the same: on the step 2 frame one row pointed the way of the idea, here all three do.
Step 5
A notification when a new range appears
The notification arrives at the moment a working range is formed. No need to sit in front of the monitors.
It reports one fact only: the range is there. What to do with it is up to the trader.
Who it fits
One mechanic across different horizons
The walkthrough above runs on two timeframes, the week and the hour. The markup is the same on both; what changes is the direction panel — it rebuilds around the working chart. On the weekly frame it reads W, M and 3M, on the hourly one 1H, 4H and D. So the horizon is yours to choose: you watch your own chart and see the picture from the higher ones.
Intraday
Working chart — 15 minutes or the hour. Higher ones — 4 hours and the day.
Swing
Working chart — 4 hours. Higher ones — the day and the week.
Position trading and investing
Working chart — the day or the week. Higher ones — the week, the month and the quarter.
What this does not change
The horizon is free, the method is not. The indicator is built for traders who already read the market through structure and context.
Settings
The markup can be tuned to your setup
On the frames above the indicator runs on its default settings. What gets drawn and how it looks can be changed: layers you do not need are switched off, the rest stays, and the palette is repainted for your theme.
What is drawn and in which colours
The functional groups decide what appears on the chart: order-flow zones — show the fresh ones and the tested ones; higher-timeframe imbalances — how many steps above the working timeframe to pull them from and how wide to draw them; lower-timeframe structure breaks — which timeframes to take them from. A separate colour group sets the palette: the direction-panel cells, the order-flow zones, the imbalances, the impulse and correction lines, the break level.


Practical value
What the trader actually gets
The value is not abstract automation. It is a more manageable process around an already selected move.
Less manual markup
Less need to rebuild the same structure visually from scratch every time the market develops.
Lower visual memory load
Ranges and states are easier to keep in view instead of relying only on what you remember from the chart.
Cleaner range awareness
It becomes easier to understand where the current move is inside its active structure.
Fewer missed moments
Important structural transitions and range events are less likely to be overlooked during routine work.
More practical notifications
Notifications help reduce the need to watch the chart constantly without disconnecting from your own plan.
More stable workflow
The scenario is easier to manage consistently from context to correction to continuation.
Learn to apply Trade Model: 2 hands-on lessons. A short walkthrough of the indicator settings and how to use it on the chart. Watch the lessons →
Important
Where the limits are
What the indicator does not do
- It does not guarantee profitability.
- It does not replace context or market logic.
- It does not create a valid scenario on its own.
- It is not a “press button and trade” tool.
- It is not built for traders looking for a blind "buy/sell" button.
FAQ
Common questions
Does it tell you what to buy and when to enter?
No. It is a scenario-support tool, not a source of ready-made entries.
Is it for finding ideas or managing them?
Mainly for managing and supporting a selected scenario after the idea is already formed. It does not replace a trading plan: the indicator becomes useful only when context, structure, and a plan are already defined by the trader.
Can I use Trade Model if I do not want to build the higher-timeframe context myself?
Yes. In that case it makes sense to lean on the analysis: we publish instrument reviews and monthly reports openly, and they set the higher-timeframe context. The indicator helps manage the scenario inside that context.
What is included in the access and how do I get it?
The Trade Model indicator in TradingView — that is the whole of the paid access; the analysis is published openly. The indicator is private (invite-only), so the manager adds your TradingView account to the allowed list by hand. It is not on sale right now — we open access gradually to the people on the queue and write to you when your turn comes.
Do I need a paid TradingView plan?
No. The indicator works on the free TradingView plan.
Which markets and timeframes does the indicator work on?
The indicator works with any TradingView instrument and timeframe. The published analysis currently covers EURUSD, XAUUSD, GER40 and GBPUSD in the market analysis feed, and four instruments in the monthly reports.
Does the markup repaint?
No. The markup does not repaint: labels, ranges and levels already drawn are not changed after the fact.
Where do the notifications arrive?
Notifications are set up with TradingView's own tools: you choose the instruments you want them for. The delivery channels are the ones TradingView provides — email, mobile push, a desktop notification and a webhook. The webhook can optionally be pointed at Telegram.
Can I get a refund?
The indicator is not on sale right now, so there is nothing to pay for and nothing to refund. Joining the queue is free and commits you to nothing. Terms for periods paid for earlier are unchanged and stay in the refund policy.
More tools
Part of one system
Analysis — published openly
Market analysis, structure breakdowns and monthly reports, free to read. Read the reviews.
Methodology explained
Articles on liquidity, market structure and trading psychology — the base this workflow relies on. Go to Learn.
Access and the queue
What the access includes and how the queue works. Go to the access page.
Where to start
Two stages: from the open indicator to the queue
The path builds up step by step: first the open indicator with no strings attached, then the queue for the full version.
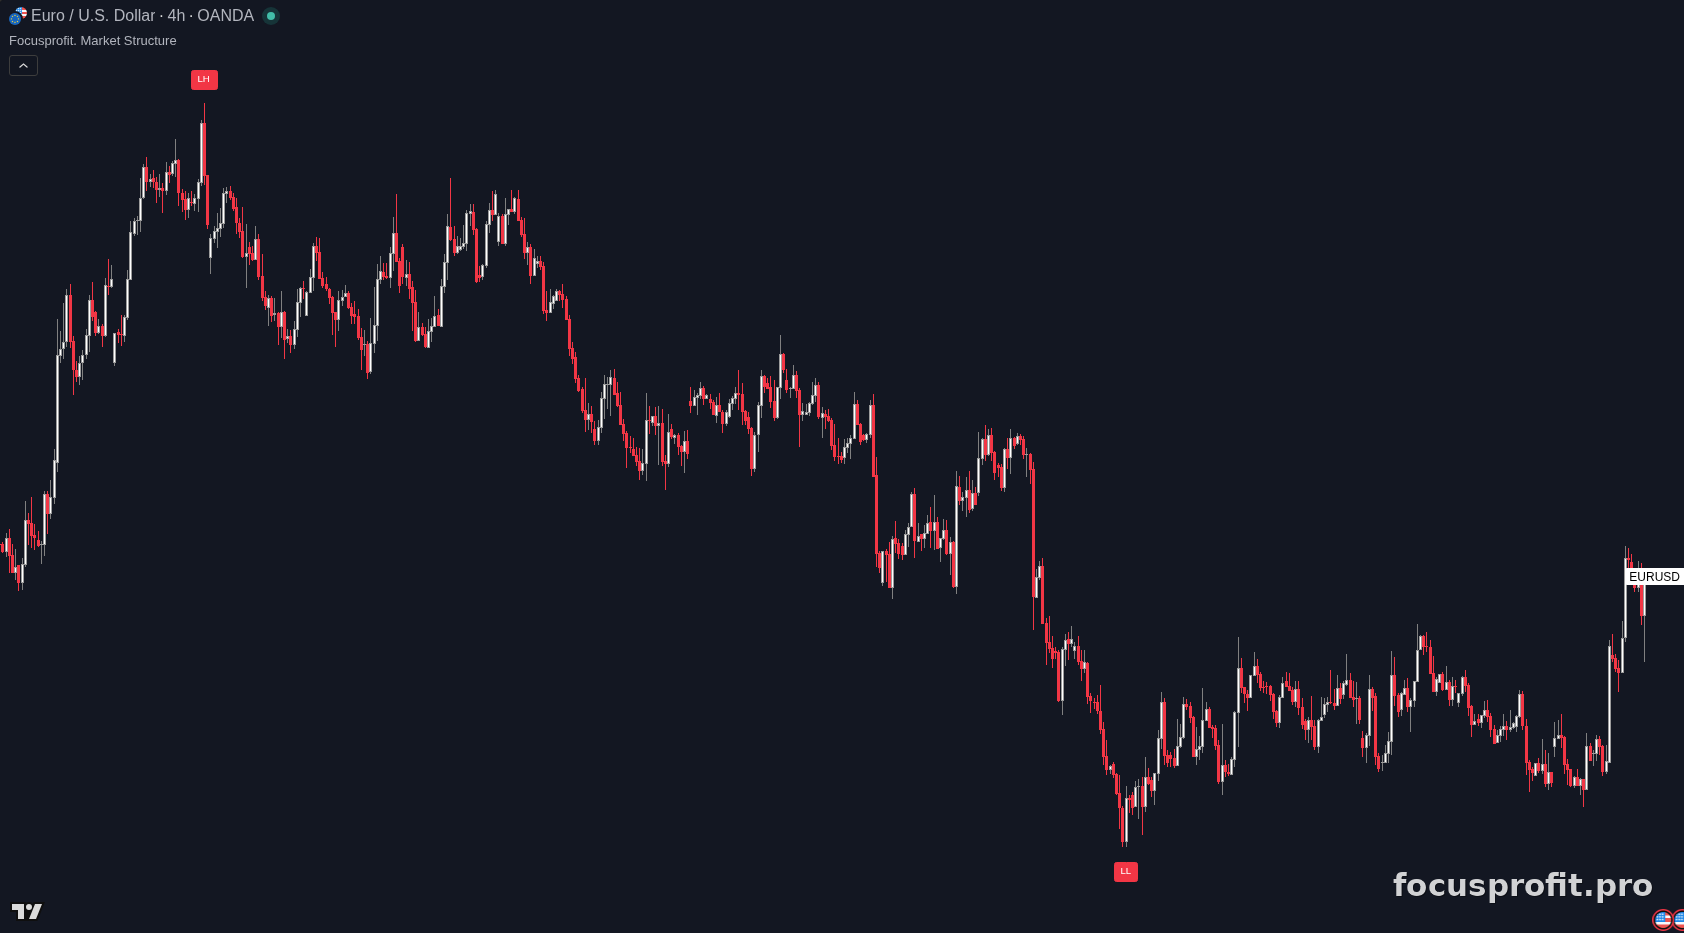
Free version: structure markup only
Stage 1
The open indicator in TradingView
Our open indicator Focusprofit. Market Structure is published in the TradingView library. It marks up market structure: HH, HL, LH, LL.
One click to add. No invite, no application, no time limit.
That is where it stops. Higher-timeframe direction, order-flow zones, imbalances and structure breaks come with the full Trade Model.
Stage 2
The queue for full access
Full access is the Trade Model indicator itself: the MTF panel, order-flow zones, imbalances, structure breaks and range alerts inside TradingView.
It is not on sale right now — we are taking signups for the queue and opening access gradually. What the access includes is on the access page.
If this workflow fits the way you already read the market — join the queue.
Trade Model is most useful for traders who already think in terms of structure, context, ranges, and scenario management. In practice, it adds clarity and a steadier process around the move you are already following. If the management logic itself fits you but you do not want to build the higher-timeframe context on your own, you can lean on the FocusProfit analysis — we publish it openly.
