Swept the monthly fractal — and got a reaction
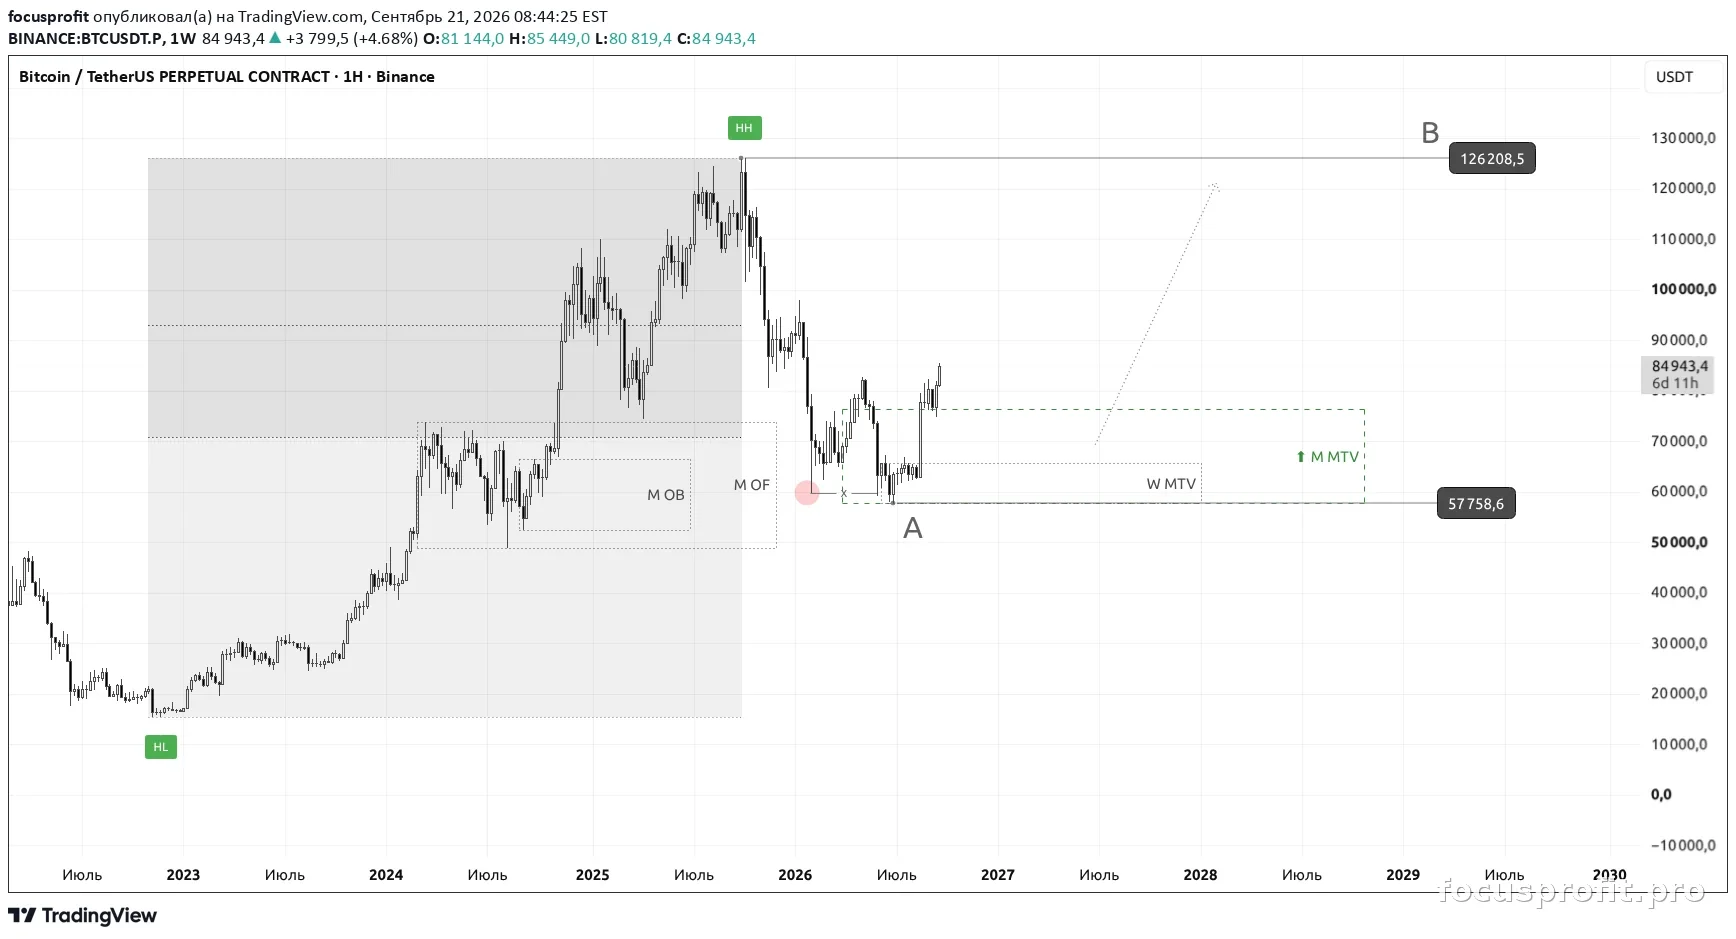
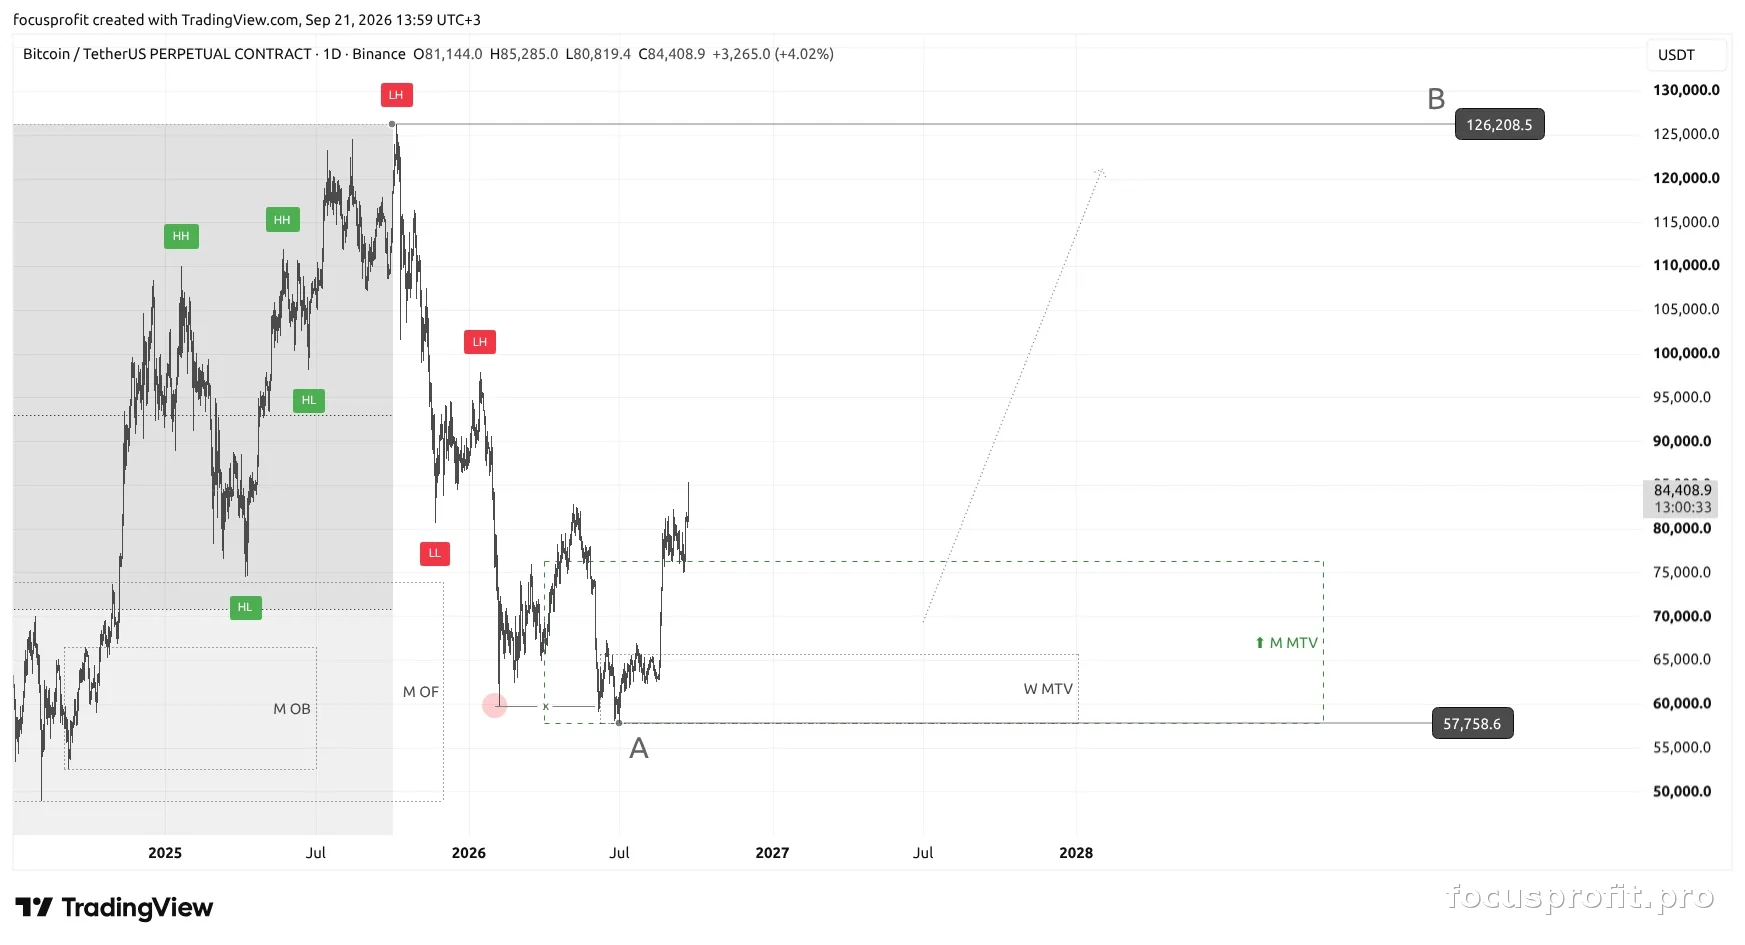
Price came into the discount of the monthly range, swept the monthly fractal and gave a confirmed reaction there. There is no structure break on the lower timeframes — and the analysis says so out loud.
Video Breakdown
Full breakdown of structure and key levels across timeframes — monthly, weekly, daily. Point A, target B and the logic of how the trade plays out.
Key Levels
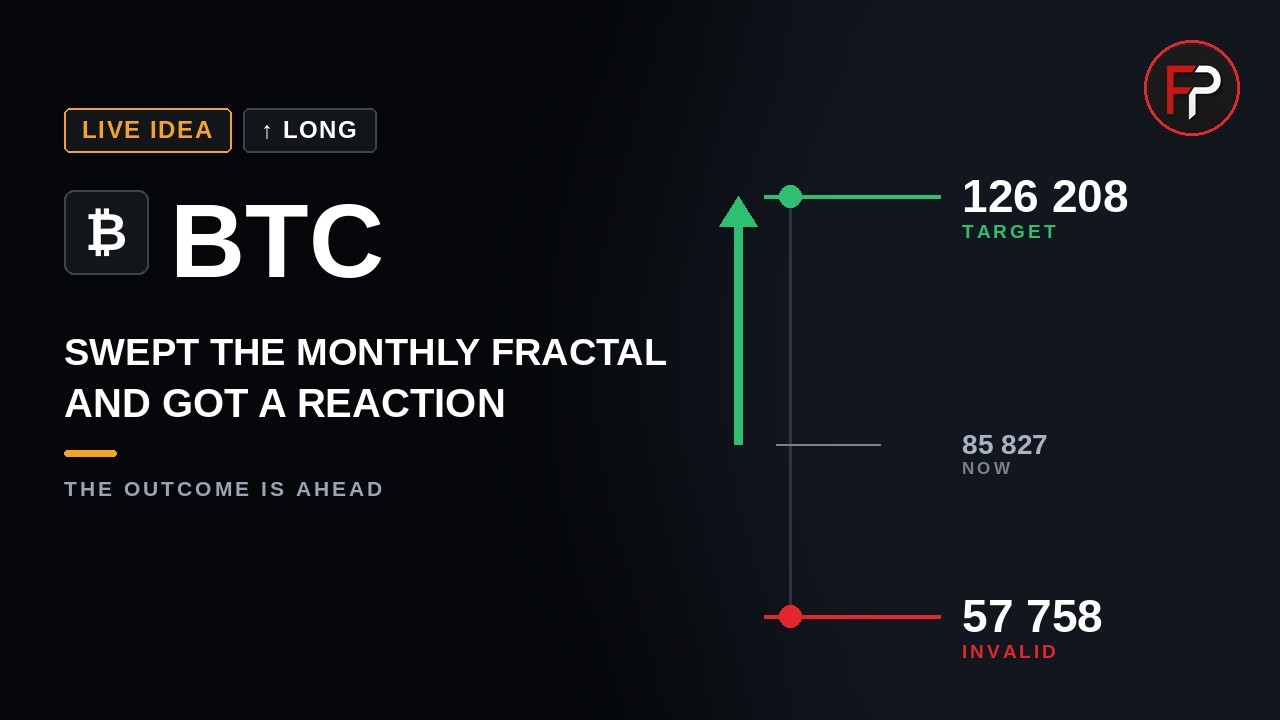
| Level | Value |
|---|---|
| Point A (invalidation) | 57758 |
| Target B | 126208 |
Price came into the discount zone of the monthly trading range and got a reaction there.
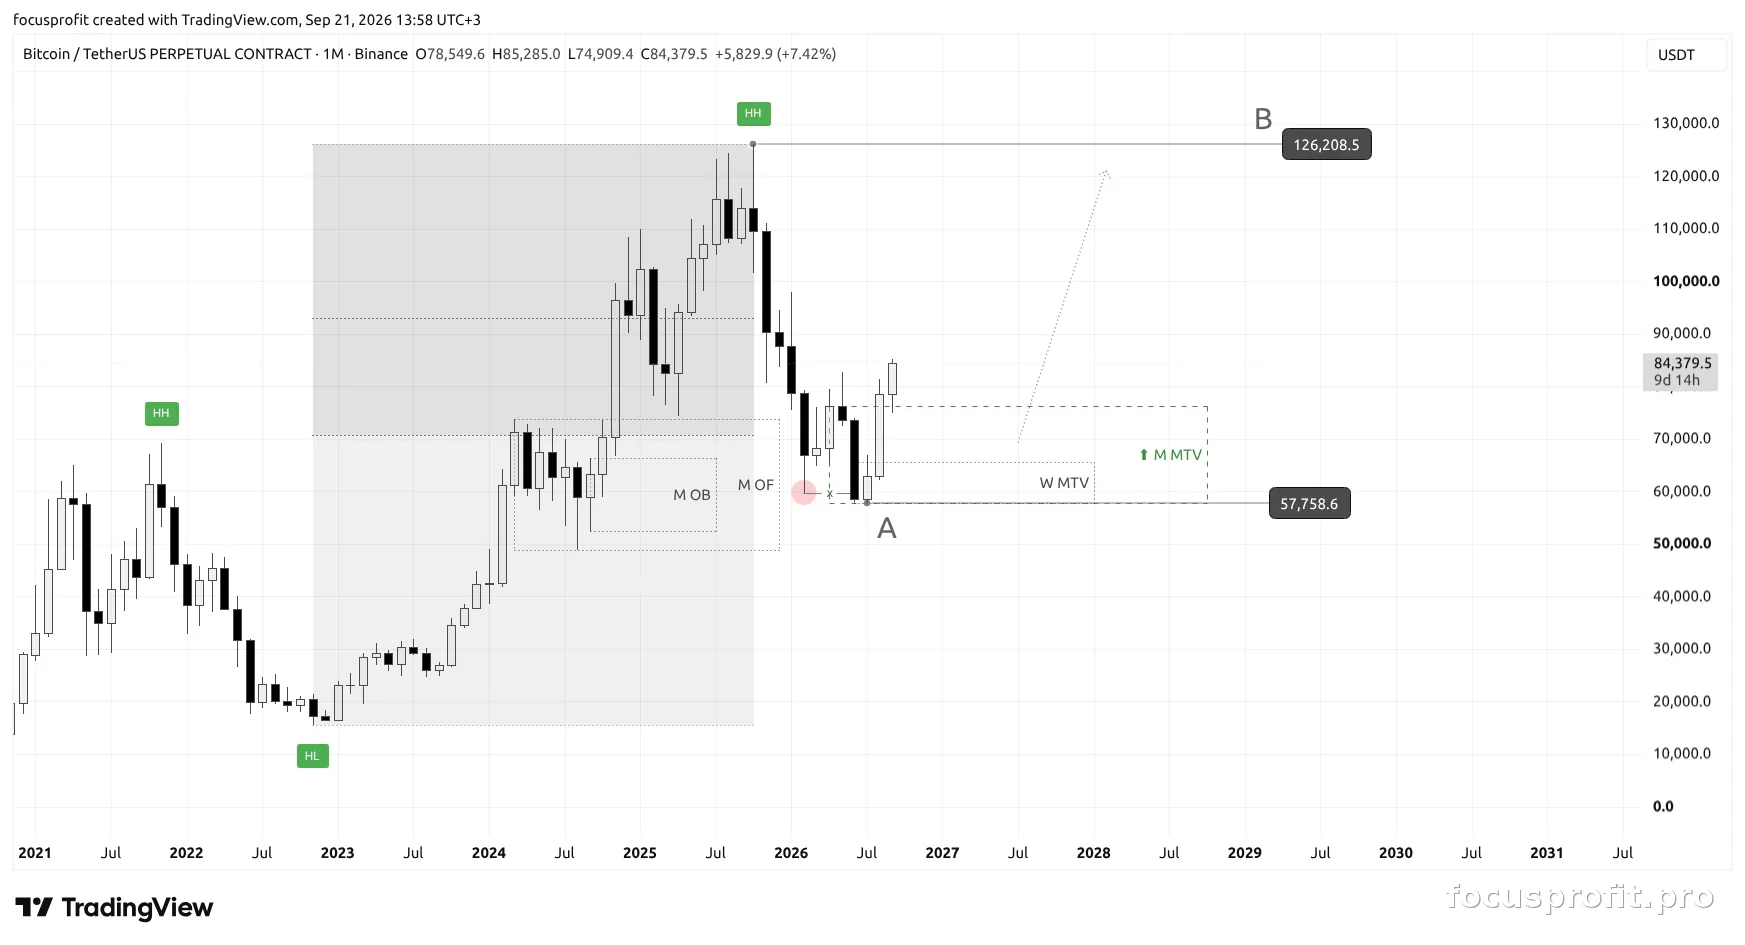
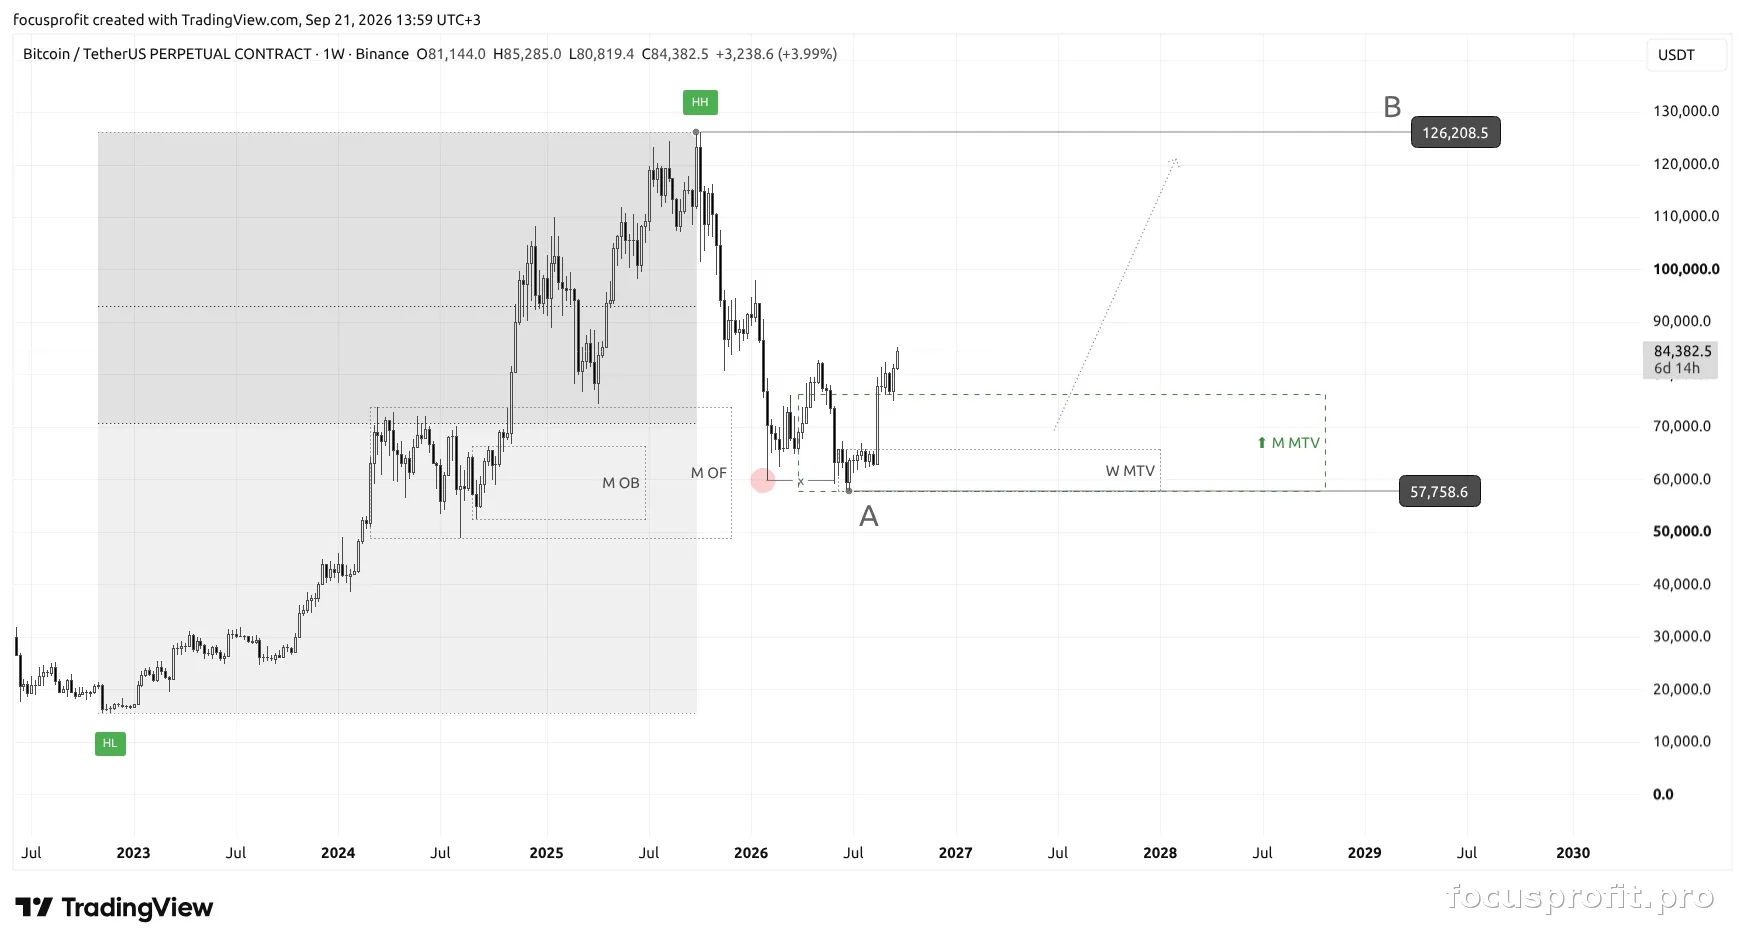
The reaction did not come from a random level: the monthly fractal sits in that discount, and the fractal itself stands inside the monthly order flow zone. On that reaction two most traded volume zones formed — a monthly one and a weekly one.
What this idea is missing. There are NO confirmations in the form of a structure break on fifteen minutes or on the hour. The nearest break sits higher.
The idea rests on the strength of the zone and on the confirmation inside it, not on lower timeframe structure. This is said in the analysis itself — and said before the outcome, not after the fact.
Higher timeframe context (1M / 1W)
Month
- Trend: up, price in the lower half of the monthly range
- Price position: discount
- Monthly fractal — 59 800
- Monthly order flow zone — 48 888.0 — 73 881.4
- Monthly most traded volume zone — 57 758.6 — 76 305.4
- The fractal stands inside the order flow zone rather than on its own: the reaction from it is confirmed by a most traded volume zone on the same timeframe
- Week
- Weekly most traded volume zone — 57 758.6 — 65 702.1
- The weekly zone starts from the same level as the monthly one and lies entirely inside it. This is not a second argument but the same one, confirmed one timeframe lower
Higher timeframe focus
- Direction: up
- Reaction area: the monthly fractal inside the monthly order flow zone, confirmed by two most traded volume zones
Execution context (1D)
Daily timeframe (1D)
- The daily timeframe shows how the reaction built up inside the zone
- Point A coincides with the lower boundary of both most traded volume zones — 57 758.6. That is not a coincidence of numbers but one and the same place
Daily focus
- Point A: 57 758 — the lower boundary of both most traded volume zones, 01.07.2026
- Point B: 126 208 — the high of the monthly trading range
Invalidation
The scenario is cancelled if price goes below Point A and holds under it. This is not a "stop at a level" but the cancellation of the idea itself: the fractal the reaction came from stops holding.
Summary
- 1M: price in discount, a reaction from the monthly fractal inside the order flow zone
- 1W: the weekly most traded volume zone repeats the monthly one from the same level
- 1D: the reaction built up inside the zone, Point A coincided with the lower boundary of both zones
- Weakness: there is no structure break on the lower timeframes
- Base scenario: priority towards Point B while Point A holds
- Point A: 57 758
- Point B: 126 208
Your thoughts?
What do you think: does it reach Point B, or does it rewrite the low first?
This is not investment advice. Analytical market structure overview.
Related
SYSTEMATIC WORK WITH THE MARKET
This material is open: no application, nothing to pay. There is one paid product — the Trade Model indicator, and it is not on sale right now: we are taking signups for the queue.
JOIN THE QUEUE