Liquidity swept — below the monthly fractal
Price went below the monthly fractal twice in the discount of the weekly range and both times closed the week back above. The analysis came out BEFORE it was known whether it would reach the range high.
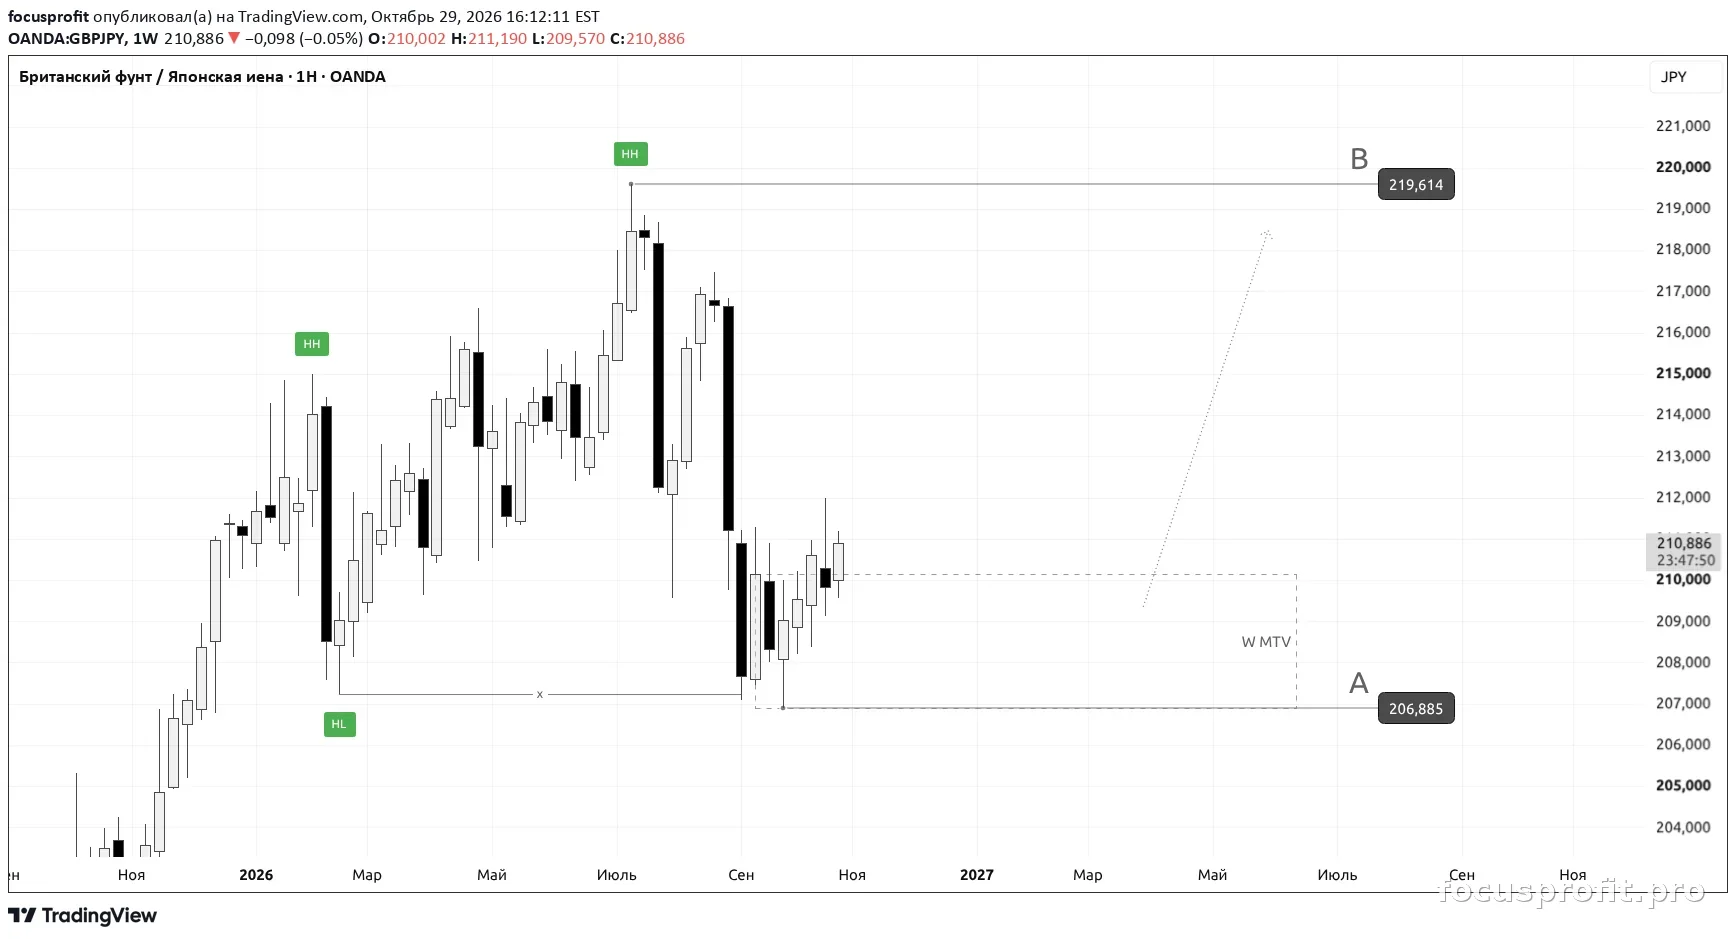
Video Breakdown
Full breakdown of structure and key levels across timeframes — monthly, weekly, daily. Point A, target B and the logic of how the trade plays out.

Key Levels
| Level | Value |
|---|---|
| Point A (invalidation) | 206.885 |
| Target B | 219.614 |
On the weekly timeframe there is a bullish trading range, and after the July high price has corrected into the discount zone. The monthly fractal sits in that discount: price swept the liquidity below it twice and both times closed the week back above.
Buyer strength is confirmed by the weekly most traded volume zone. The priority is a continuation higher toward the range high.
Higher-Timeframe Context (1M / 1W)
Monthly Context (1M)
- Trend: bullish
- Monthly fractal: 207.238 — the February 2026 low
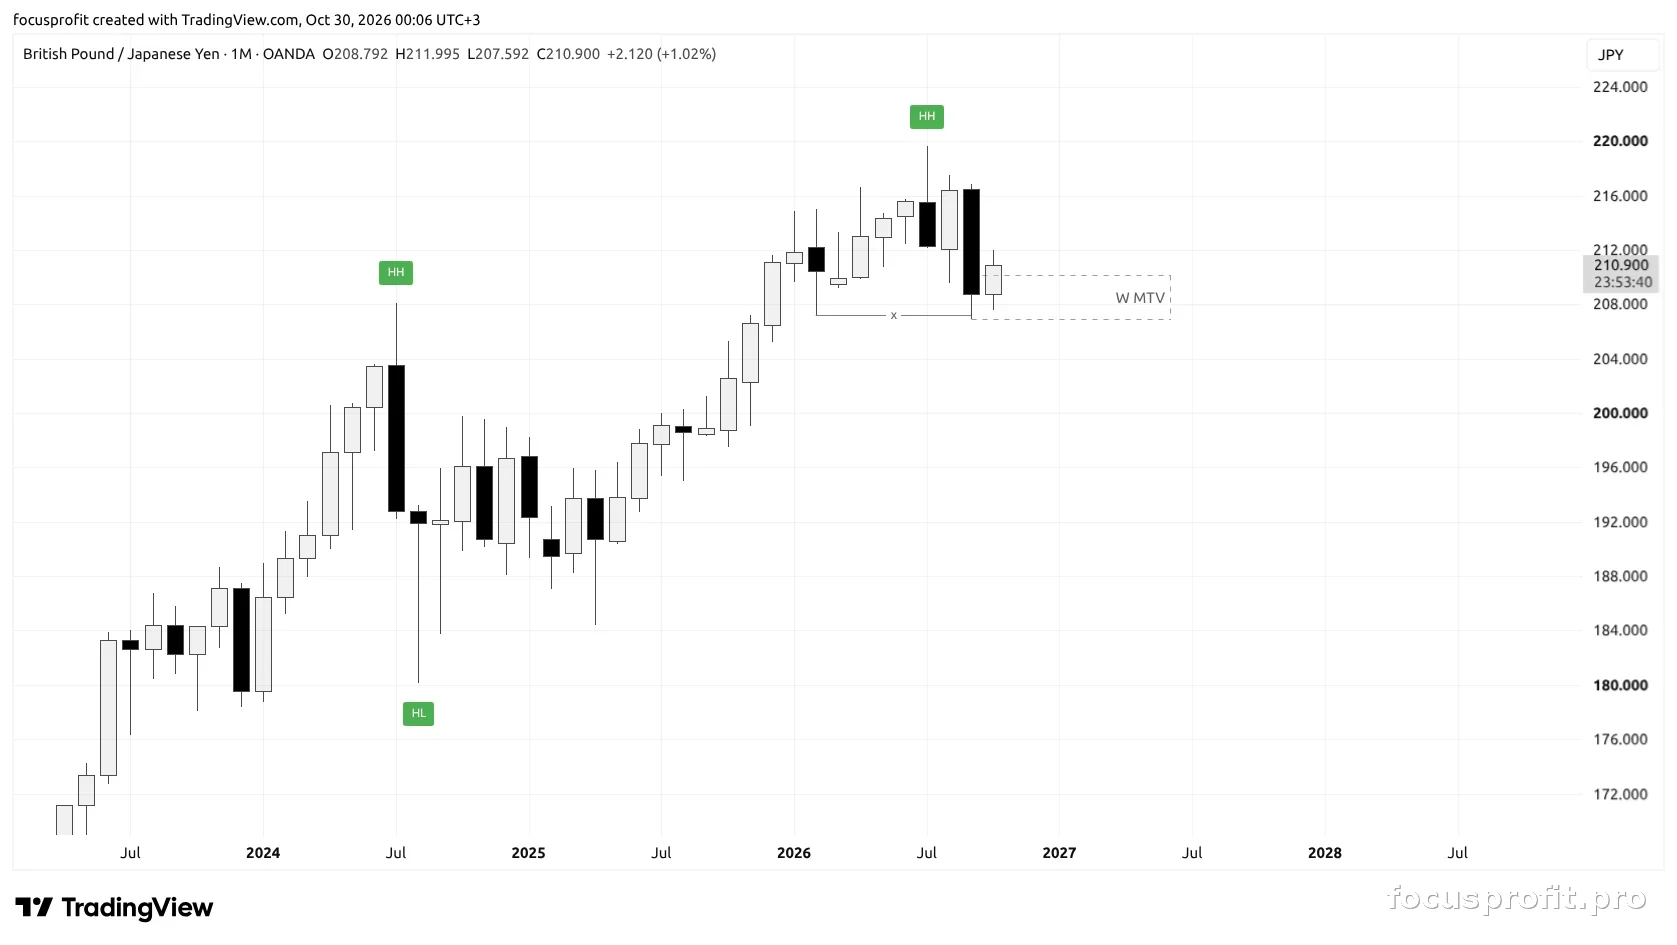
Weekly Context (1W)
- Trend: bullish
- Trading range: bullish, 207.238 — 219.614
- Price location: discount, 30% of the range height
- Interaction: liquidity sweep below the monthly fractal — lows at 207.100 and 206.885, weekly closes back above the fractal
- Buyer strength confirmed by the weekly most traded volume zone, 210.142 — 206.885
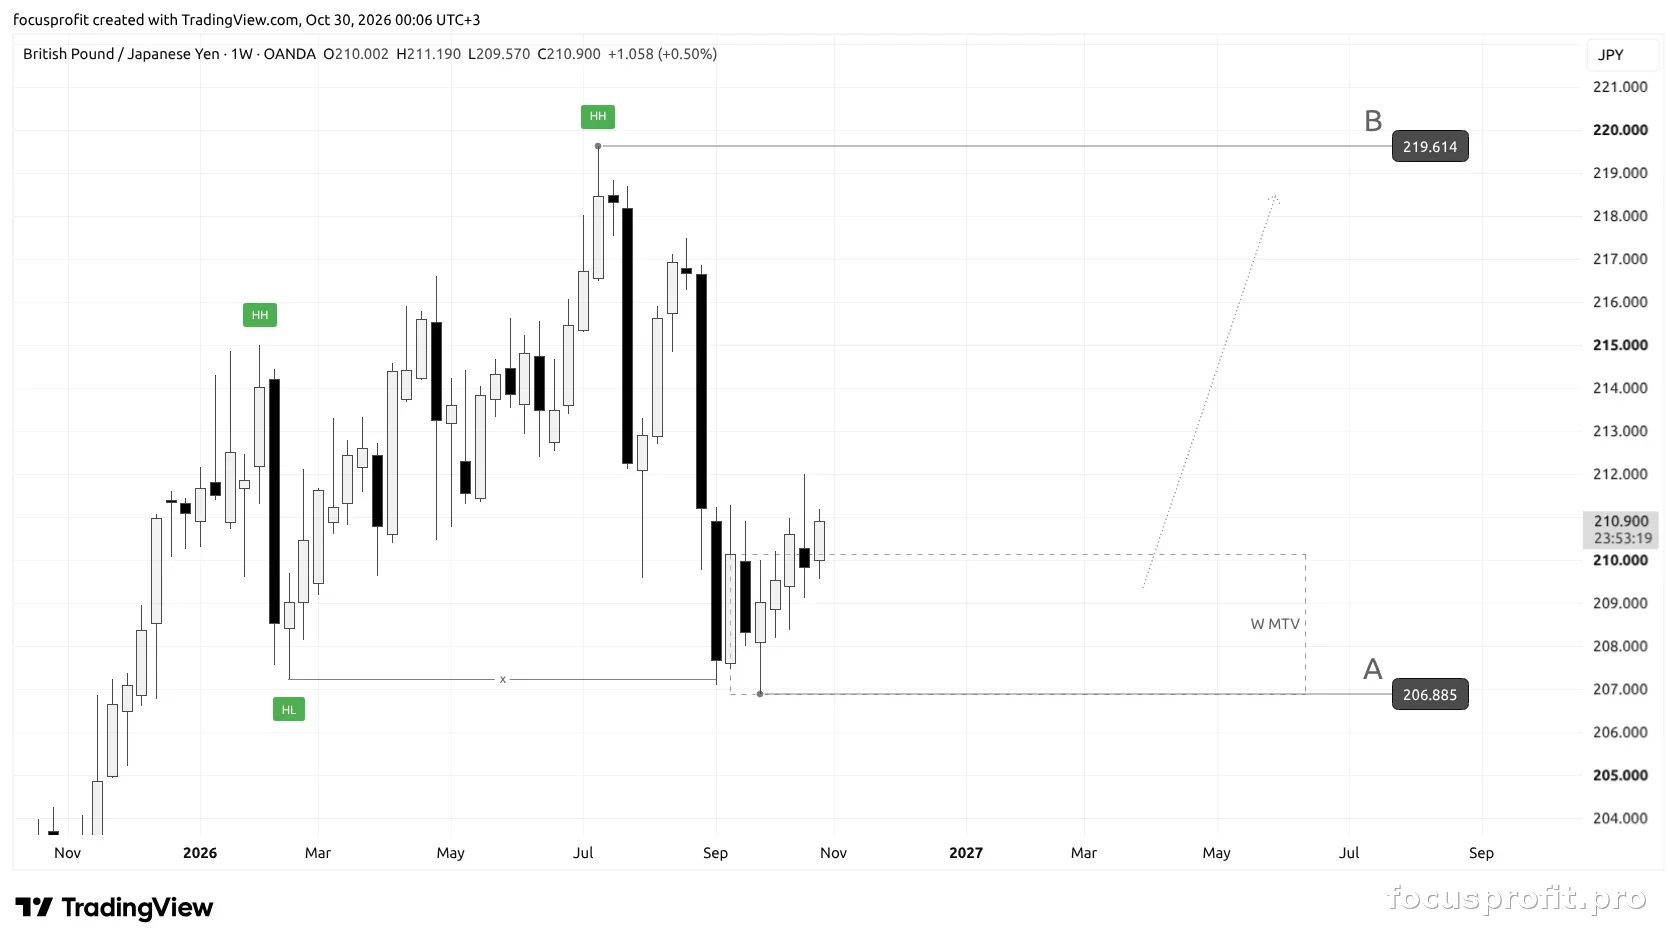
Higher-timeframe focus
- Direction: bullish
- Area of reaction: the monthly fractal in the discount of the weekly range
Execution Context (1D)
Daily timeframe (1D)
- Trend: bearish — this is the correction of the weekly move
- Trading range: bearish, 219.614 — 206.885
- Price location: discount
- The range low at 206.885 is the liquidity sweep below the monthly fractal
- Price has moved above the weekly most traded volume zone and holds above it
Daily focus
- Point A: 206.885 — the low of the daily range, the liquidity sweep below the monthly fractal, and the lower boundary of the weekly volume zone
- Point B: 219.614 — the high of the trading range
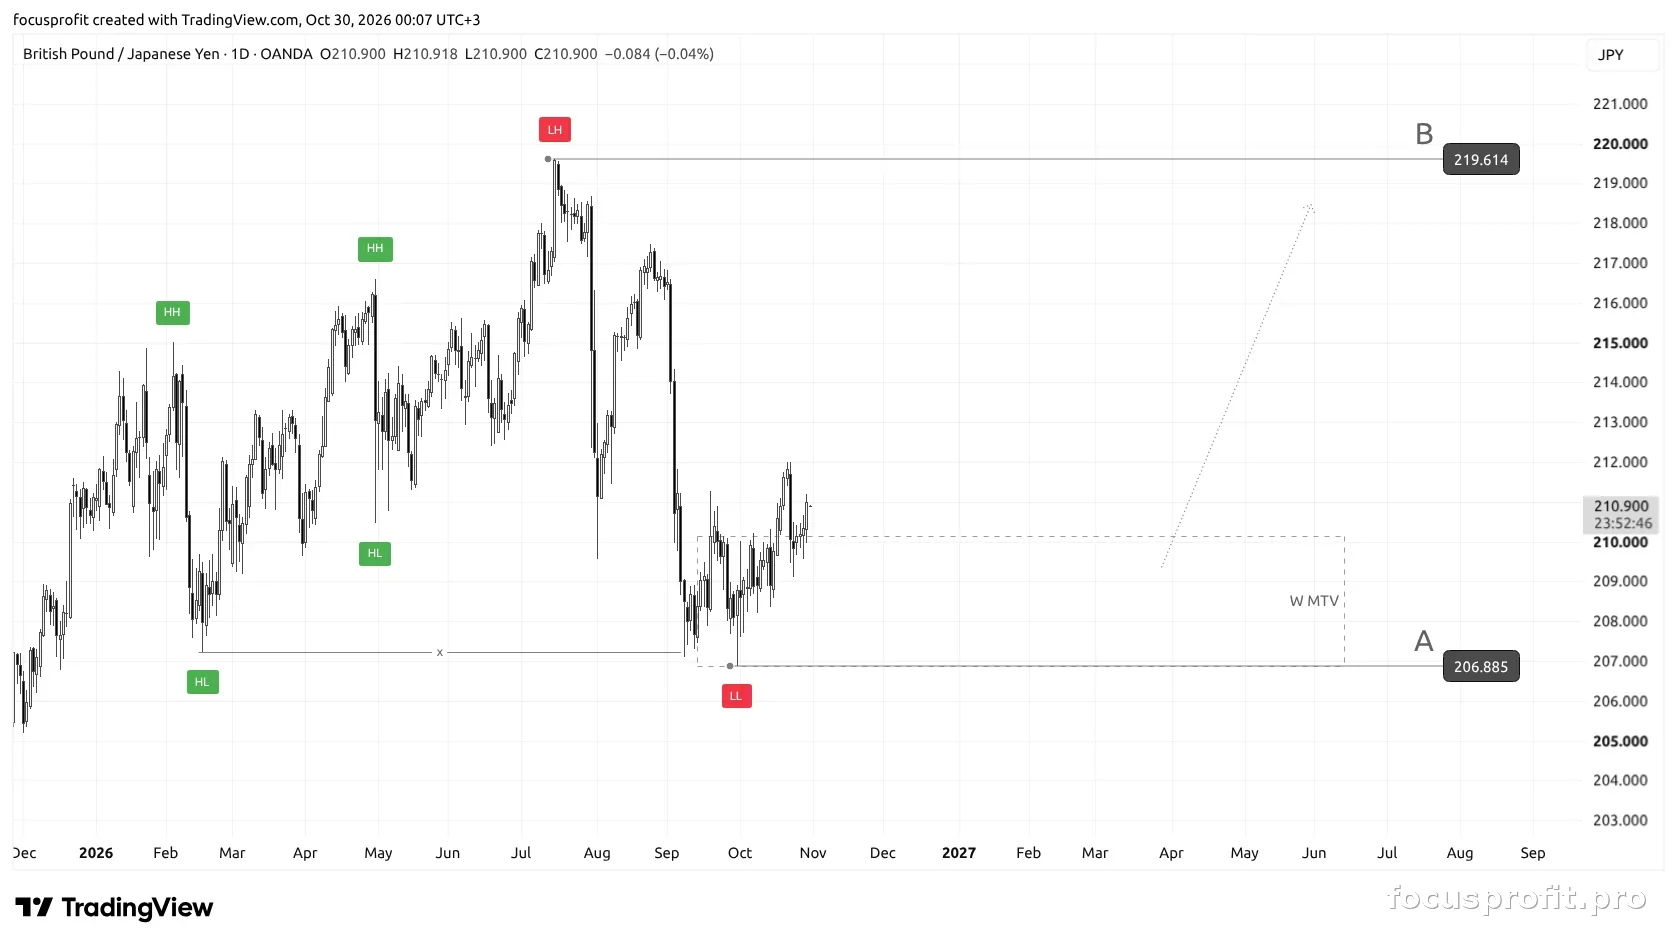
Invalidation
The scenario stays valid while price holds above the weekly most traded volume zone. A candle body closing below 206.885 means the correction is not over and invalidates the idea.
Summary
- 1M: bullish trend, monthly fractal at 207.238
- 1W: bullish range, price in discount, liquidity sweep below the monthly fractal, buyer strength confirmed by the weekly volume zone
- 1D: bearish range — the correction of the weekly move, price in discount and above the weekly volume zone
- Base scenario: continuation higher toward the range high
- Point A: 206.885
- Point B: 219.614
4H Ranges
Ranges: 3 · worked out: 3 · did not: 0
| Formed | Boundaries | Outcome | Check |
|---|---|---|---|
| 2026-10-01 | 207.592 – 210.006 | WIN | On 07.10 a 4H candle closed at 210.106 — above the upper boundary |
| 2026-10-14 | 208.366 – 210.312 | WIN | On 16.10 a 4H candle closed at 210.592 — above the upper boundary |
| 2026-10-23 | 209.122 – 211.995 | WIN | On 02.11 a 4H candle closed at 211.996 — above the upper boundary |
What do you think?
Which scenario are you watching: a continuation higher toward the range high, or one more sweep below the monthly fractal before the move?
This is not investment advice. Analytical market structure overview.
Related
SYSTEMATIC WORK WITH THE MARKET
This material is open: no application, nothing to pay. There is one paid product — the Trade Model indicator, and it is not on sale right now: we are taking signups for the queue.
JOIN THE QUEUE