GBPUSD — Market Outlook | MTF 1M → 1W → 1D
Structure break inside the monthly order flow | scenario toward the low of the daily dealing range
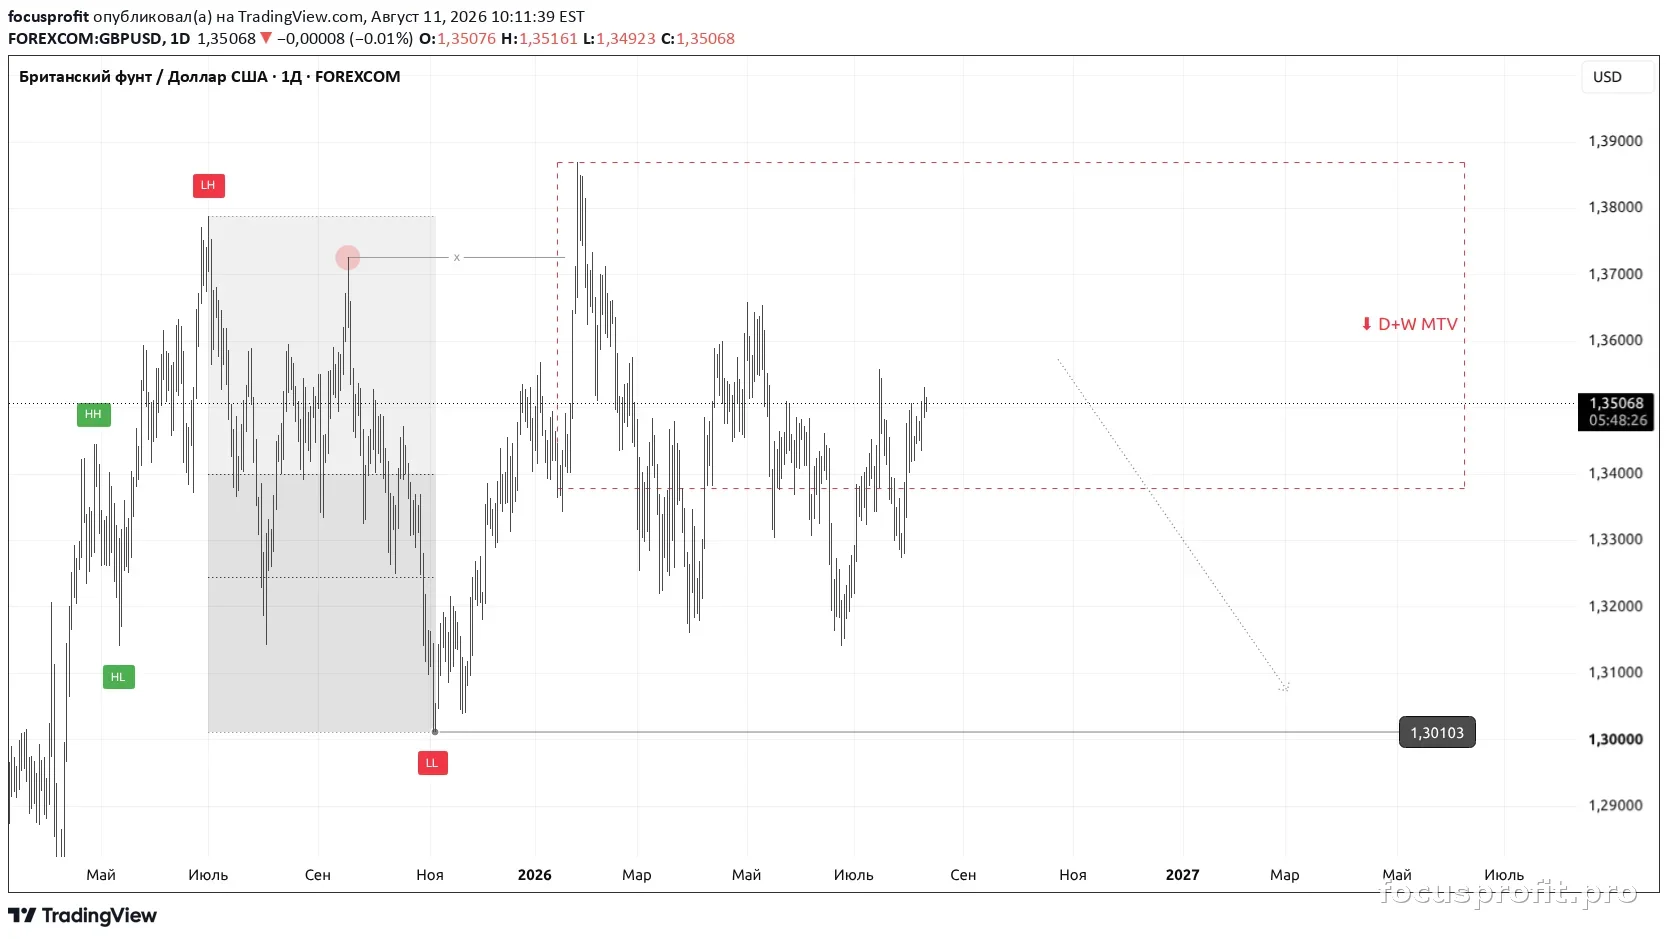
Video Breakdown
Full breakdown of structure and key levels across timeframes — monthly, weekly, daily. Point A, target B and the logic of how the trade plays out.
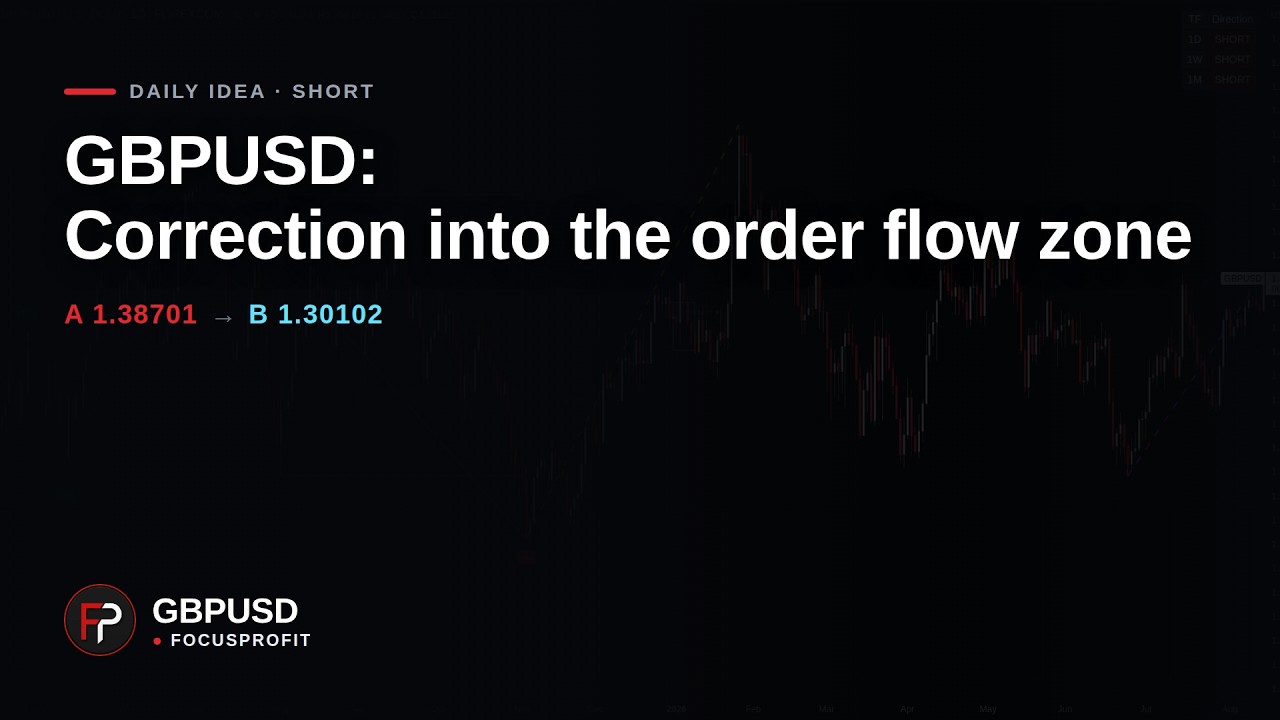
Key Levels
| Level | Value |
|---|---|
| Point A (invalidation) | 1.38701 |
| Target B | 1.30103 |
Point A Correction
Point A was corrected on 13 August 2026: the correct value is 1.38701, the upper boundary of the D + W MTV area (the high of the 27 January 2026 bar). The TradingView publication of 11 August 2026 shows 1.33785; it cannot be edited — the platform allows edits for 15 minutes after posting. Range calculations and reports use 1.38701.
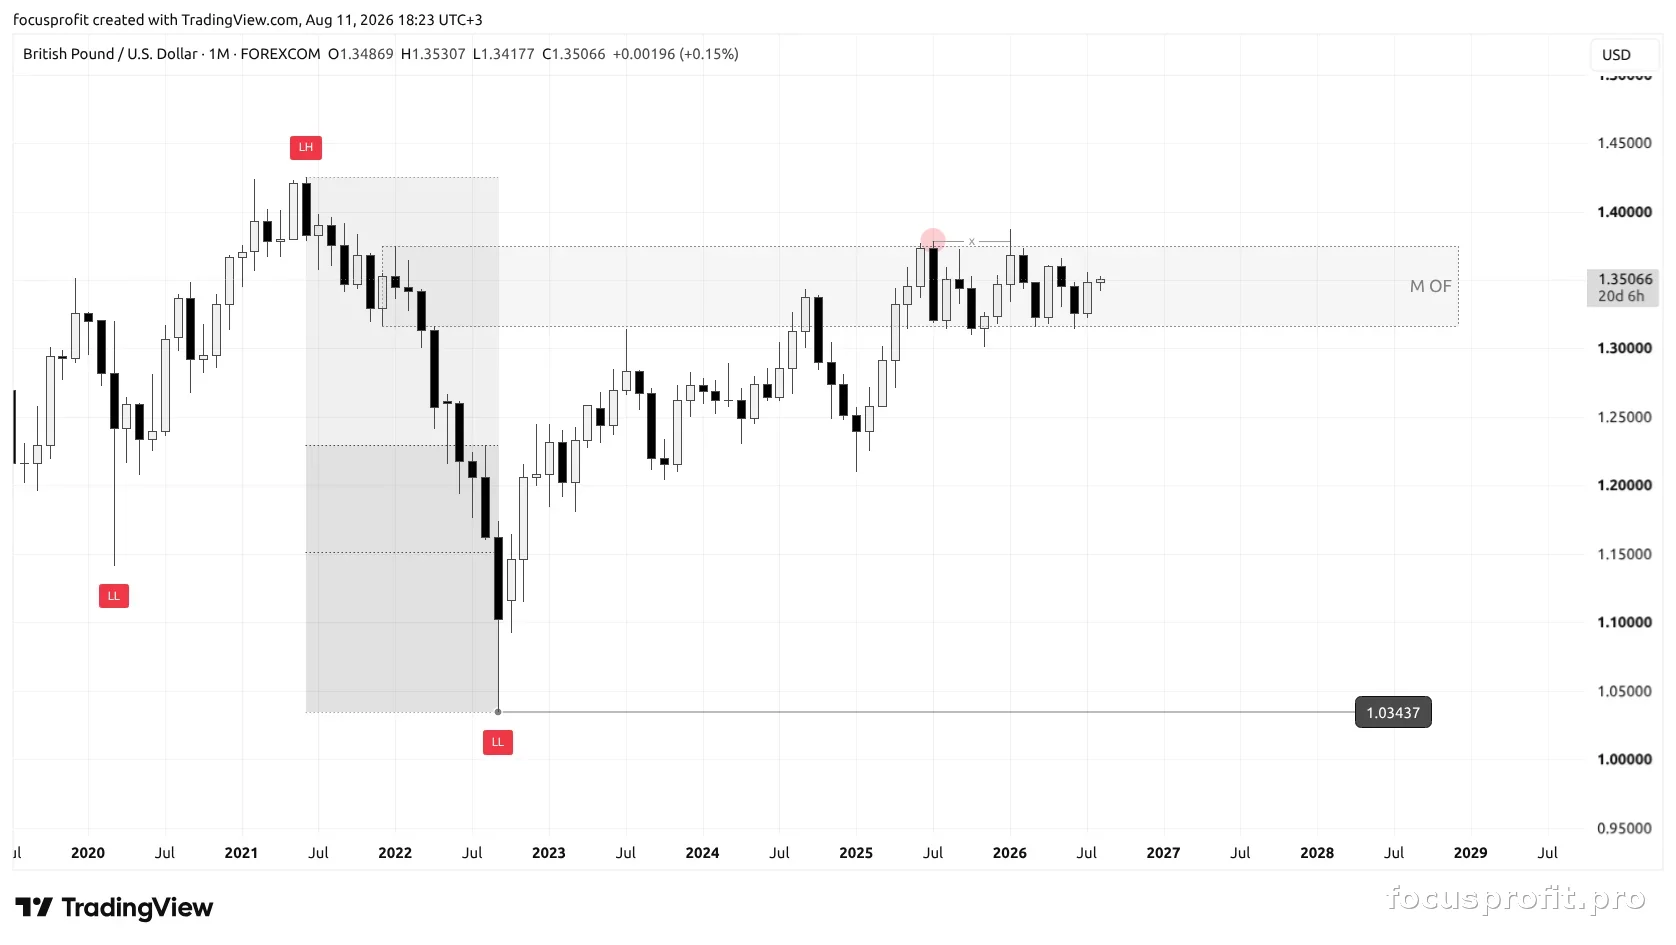
On the monthly — a bearish dealing range, price in a correction into the premium zone. A structure break on the daily timeframe occurred inside the monthly order flow.
The correction on the monthly and weekly is complete. Priority is a continuation of the downside move toward the low of the daily dealing range.
Higher-Timeframe Context (1M / 1W)
Monthly and weekly
- Trend: bearish
- Dealing range: bearish
- Price position: premium
- Interaction: monthly fractal inside the monthly order flow (M OF)
- Price returned to the area it previously left with an impulse, and that area is holding it
Higher-timeframe focus
- Direction: bearish
- Reaction area: monthly fractal inside the monthly order flow
Execution Context (1D)
Daily timeframe (1D)
- Trend: bearish
- Price position: premium
- Interaction: monthly and weekly fractals
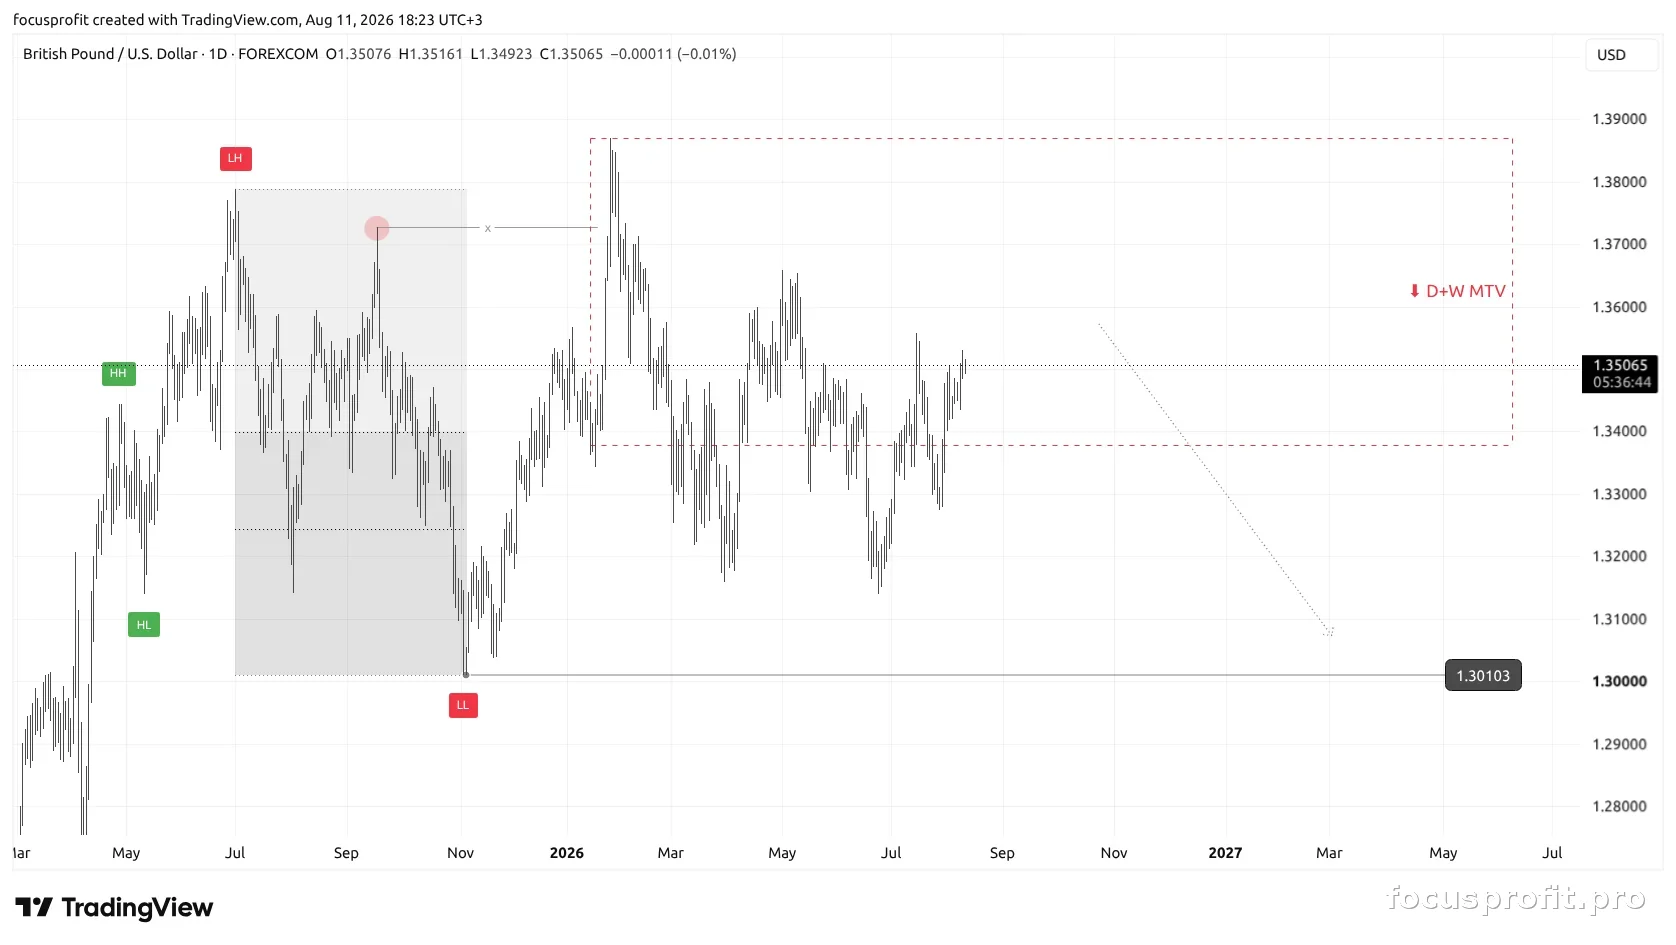
- The structure break occurred in November 2025, after which price formed a correction into the premium zone
- The reaction after the break was strong: the fractal inside the premium of the bearish daily range was swept, and so was the range high as liquidity
- Confirmation of seller strength on this leg — the formation of a zone that is both daily and weekly (D + W MTV): liquidity was taken, the move continued down
- The correction into the premium of the monthly and weekly ranges is complete
Daily focus
- Point A: 1.38701 — the upper boundary of the D + W MTV zone, the high of the 27 Jan 2026 bar: that is where liquidity above the daily range high was taken, with no acceptance above
- Point B: 1.30103 — the low of the daily dealing range
Invalidation
The scenario is valid while price stays below 1.38701. A candle body closing above the level invalidates the idea.
Analysis Summary
- 1M / 1W: bearish trend and dealing range, price in premium, reaction from the monthly fractal inside the monthly order flow
- 1D: structure break in November 2025, liquidity of the premium fractal and of the range high taken, daily and weekly zone formed
- Base scenario: continuation of the downside move toward the low of the daily range
- Point A: 1.38701
- Point B: 1.30103
4H Ranges
Ranges: 3 · worked out: 3 · did not: 0
| Formed | Boundaries | Outcome | Check |
|---|---|---|---|
| 2026-09-09 | 1.34747 – 1.35681 | WIN | On 14.09 price made a new low at 1.34641 — below the lower boundary |
| 2026-09-14 | 1.34641 – 1.35138 | WIN | On 29.09 price made a new low at 1.32024 — below the lower boundary |
| 2026-09-30 | 1.32024 – 1.3311 | WIN | On 01.10 a 4H candle closed at 1.31849 — below the lower boundary |
Your thoughts?
Which scenario do you see: a continuation lower from the current zone, or an attempt by buyers to regain control over it?
This is not investment advice. Analytical market structure overview.
Related
SYSTEMATIC WORK WITH THE MARKET
This material is open: no application, nothing to pay. There is one paid product — the Trade Model indicator, and it is not on sale right now: we are taking signups for the queue.
JOIN THE QUEUE