Broke the ATH — and came back to the imbalance
The break of the all-time high left a monthly imbalance behind. Two months later price came back to it — and the analysis came out BEFORE it was known whether it would hold.
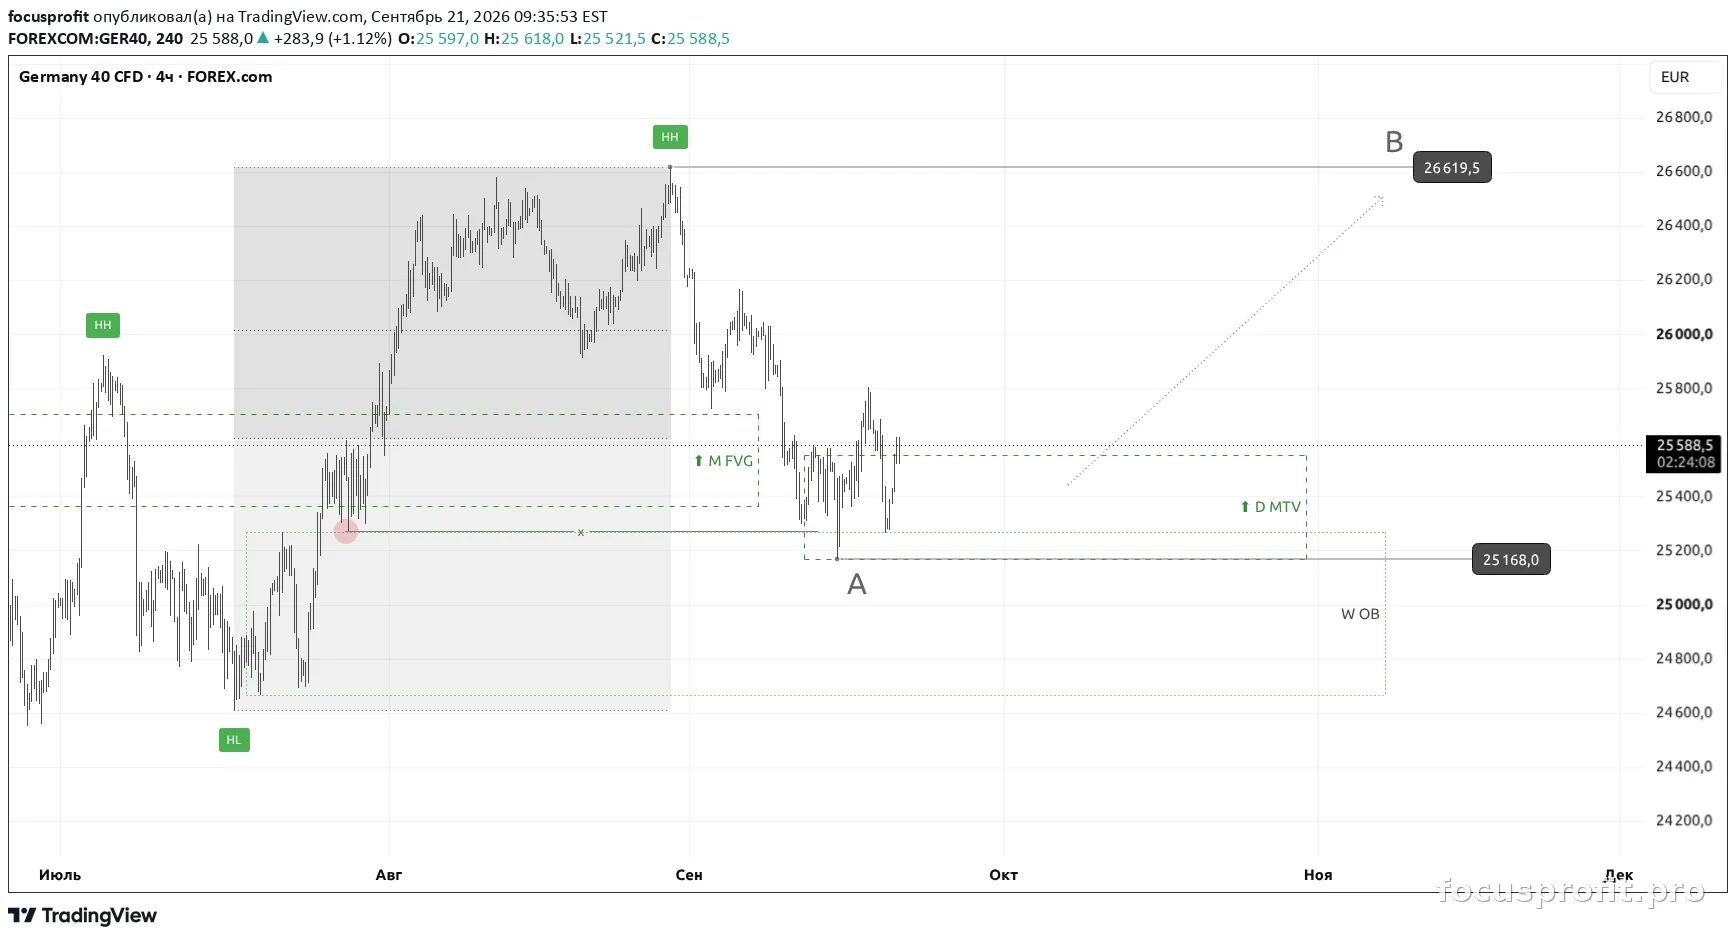
Video Breakdown
Full breakdown of structure and key levels across timeframes — monthly, weekly, daily. Point A, target B and the logic of how the trade plays out.

Key Levels
| Level | Value |
|---|---|
| Point A (invalidation) | 25168 |
| Target B | 26619 |
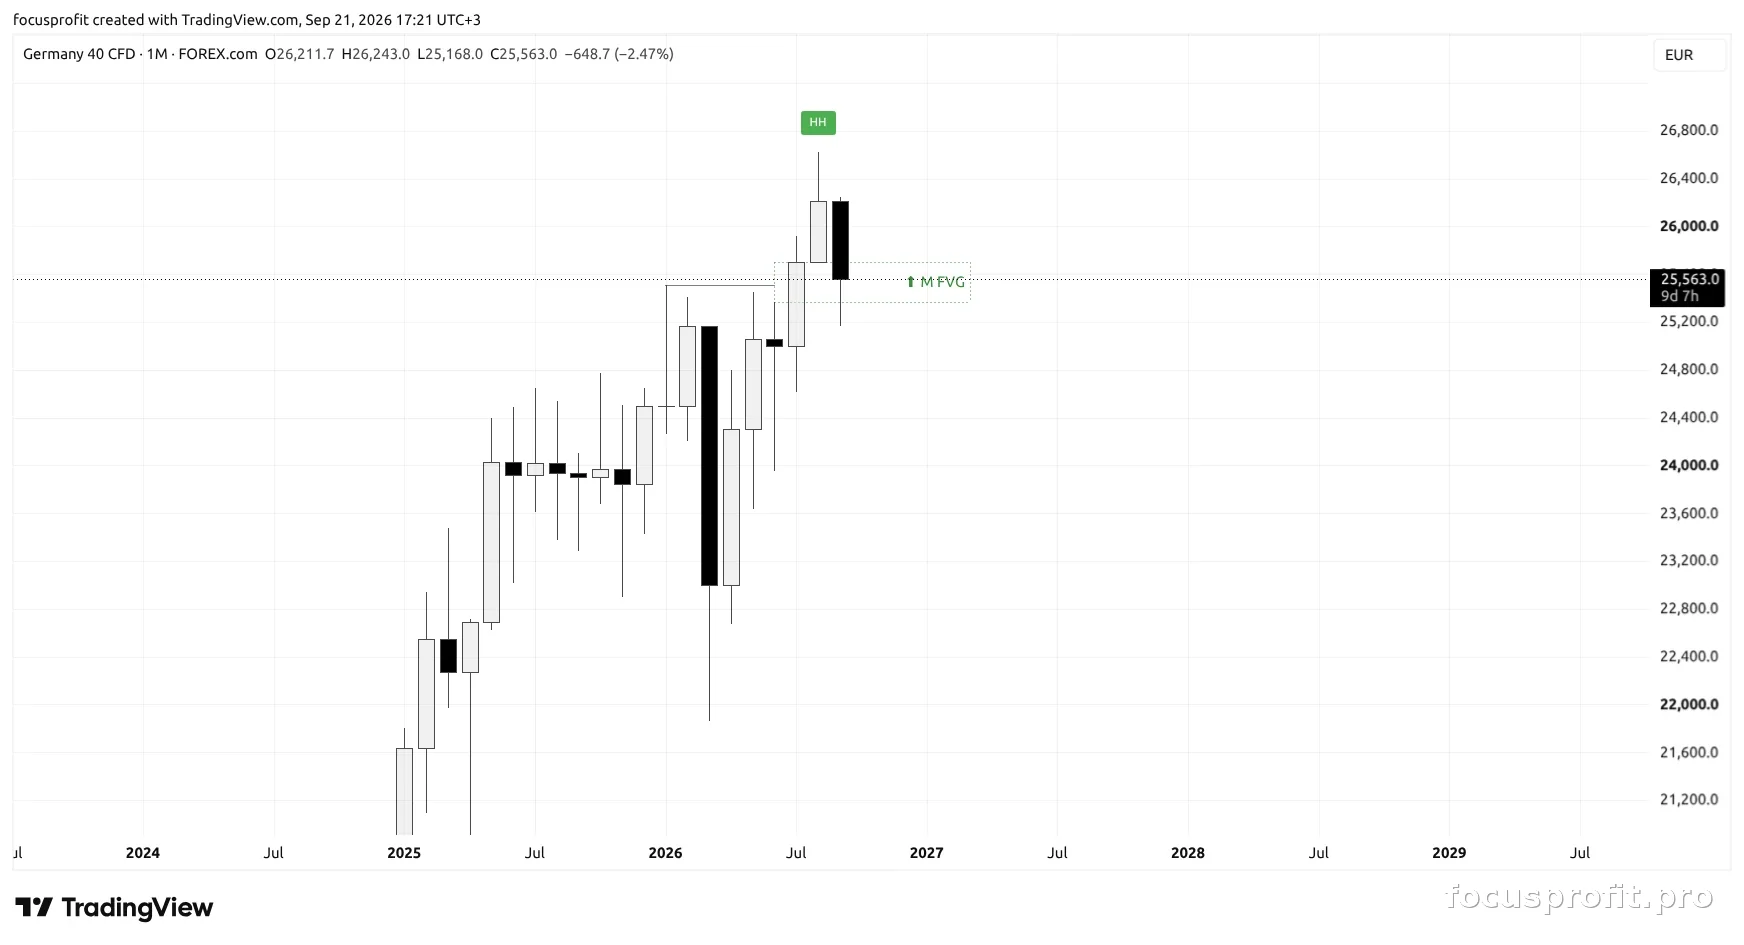
In July price broke the all-time high and held above it. The break happened with an imbalance: the body of the candle left a monthly gap on the overlap of the previous extreme. In September price came back to that imbalance.
Relative to the weekly and the daily, price is in premium at that moment — the test comes from the expensive side, not the cheap one. The correction reached thirty percent. So the working range is taken lower, on the four-hour: there price is already in discount.
Higher timeframe context (1M / 1W)
Month and week
- Trend: up
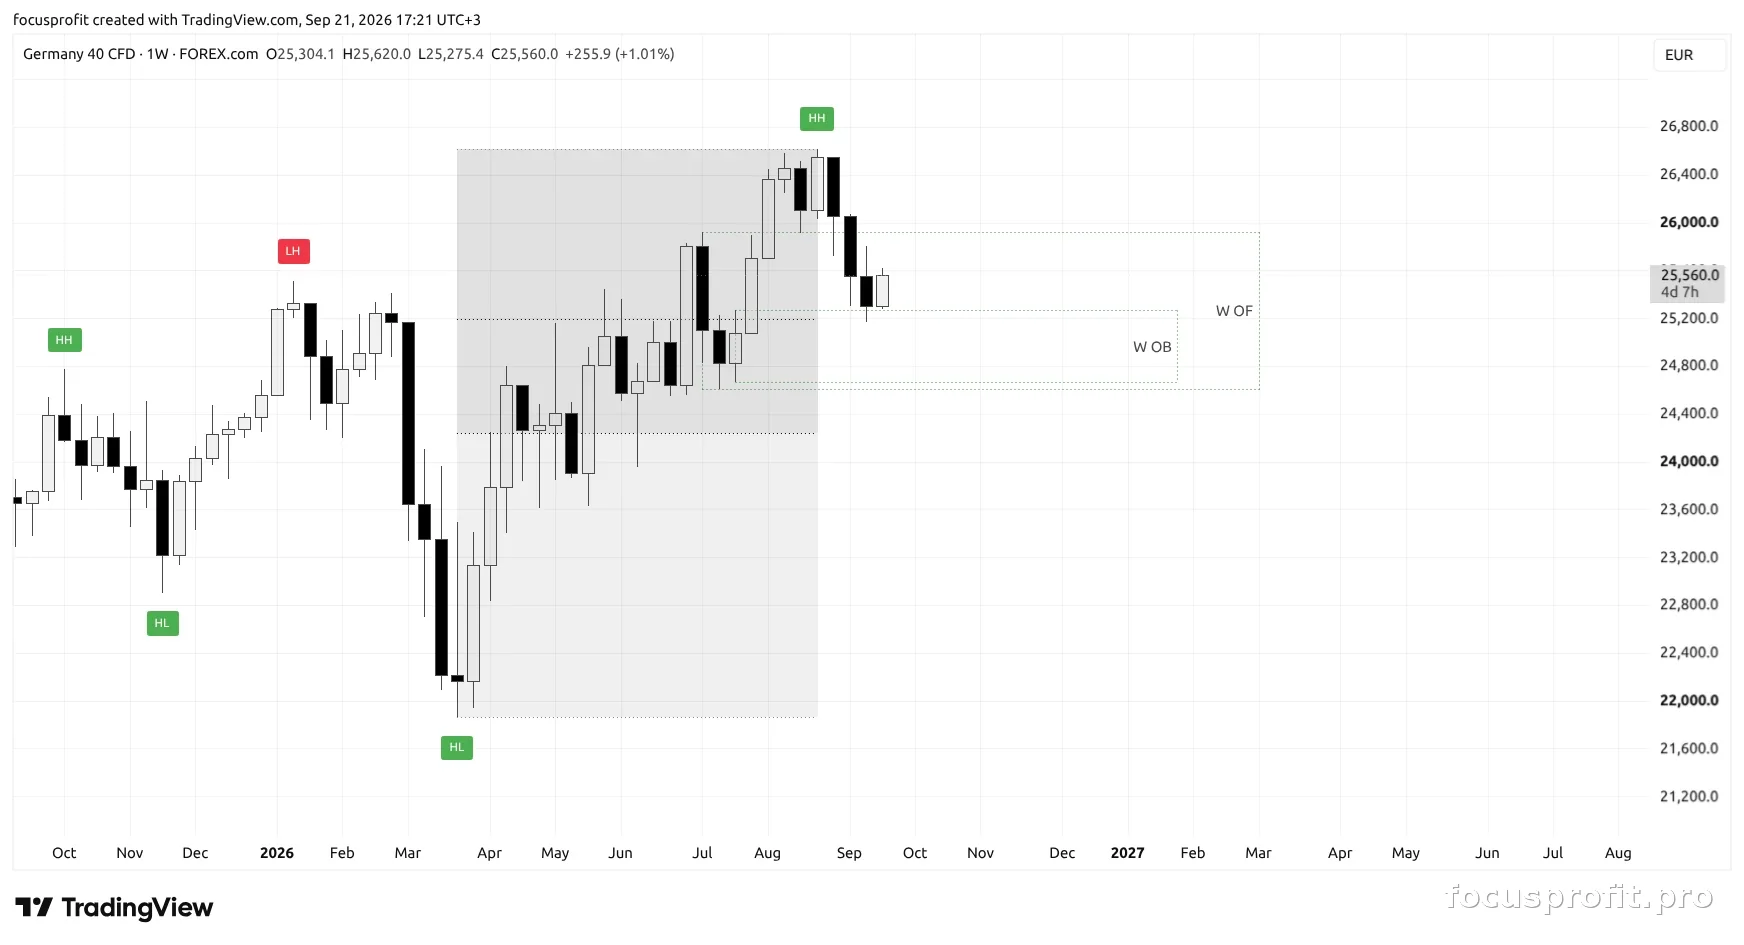
- Trading range: forming on the monthly, the extreme confirmed on the weekly
- Price position: premium relative to the weekly and the daily
- Interaction: the monthly imbalance left by the all-time high break
- The imbalance sits on the overlap of the previous extreme — the place price left with an impulse, and the same place where the liquidity of the broken high remained
Higher timeframe focus
- Direction: up
- Reaction area: the monthly imbalance on the overlap of the broken all-time high
Execution context (1D → 4H)
Daily timeframe (1D)
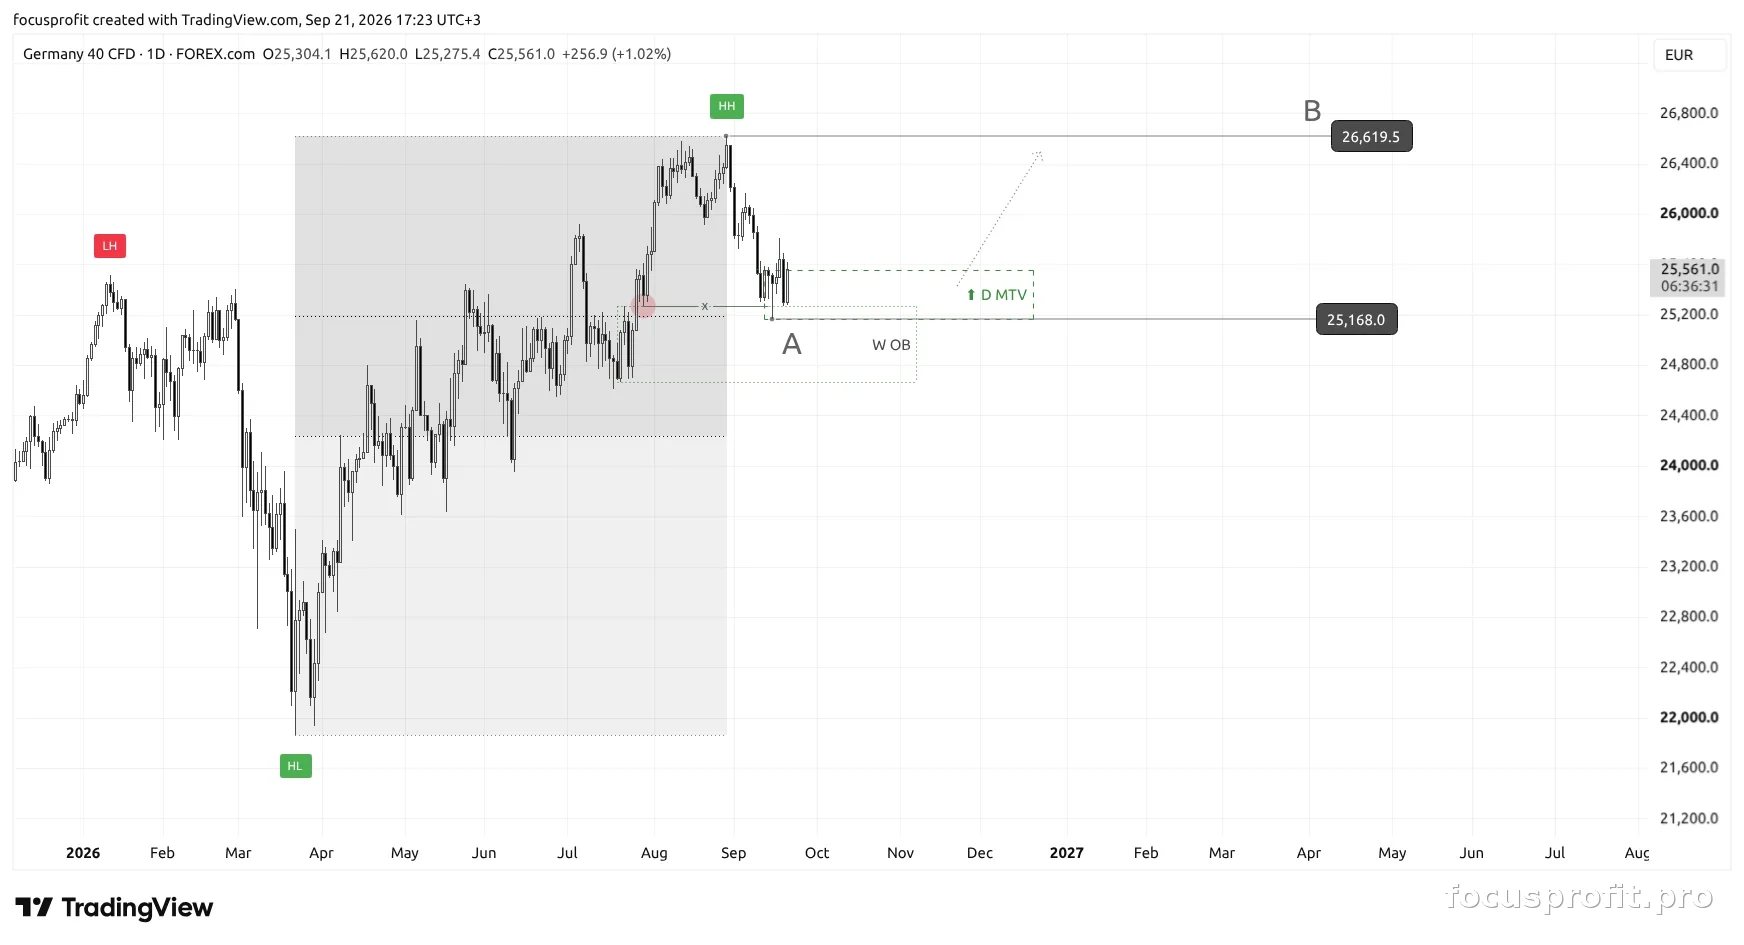
- Price sweeps liquidity from the daily fractal and closes the body above it — a sweep, not a breakout
- The reaction comes in a strong order flow zone with an order block inside; the zone carries a one-star rank on both the weekly and the daily
- A daily most traded volume zone formed at 25 168 — 25 554, and it sits at the break of structure
- Working timeframe (4H)
- Price position: discount of the four-hour range
- By that point the hourly structure has reversed: the initiative changed from selling to buying
- Three confirmations — the daily fractal sweep, the reaction in the order flow zone, the reversal of the hourly structure — and only after them the plan is built
Daily focus
- Point A: 25 168 — the lower boundary of the daily most traded volume zone, 15.09.2026
- Point B: 26 619 — the high of the trading range
Invalidation
The scenario holds while price is above 25 168. A candle body closing below that level cancels the idea.
Summary
- 1M / 1W: the all-time high broken with an imbalance, price back to it from premium, a thirty percent correction
- 1D: a daily fractal sweep with the body closing above, a reaction in a strong order flow zone, a daily most traded volume zone at the break of structure
- 4H: price in discount, the hourly structure reversed
- Base scenario: a move back to the high of the trading range
- Point A: 25 168
- Point B: 26 619
Your thoughts?
What do you think: does the imbalance hold and price head for the range high — or does it take the liquidity below Point A first?
This is not investment advice. Analytical market structure overview.
Related
SYSTEMATIC WORK WITH THE MARKET
This material is open: no application, nothing to pay. There is one paid product — the Trade Model indicator, and it is not on sale right now: we are taking signups for the queue.
JOIN THE QUEUE