XAUUSD — Market Outlook | SHORT trading plan of 22.04.2026
SHORT scenario of 22.04.2026 | trend towards the low of the weekly dealing range (W DR)
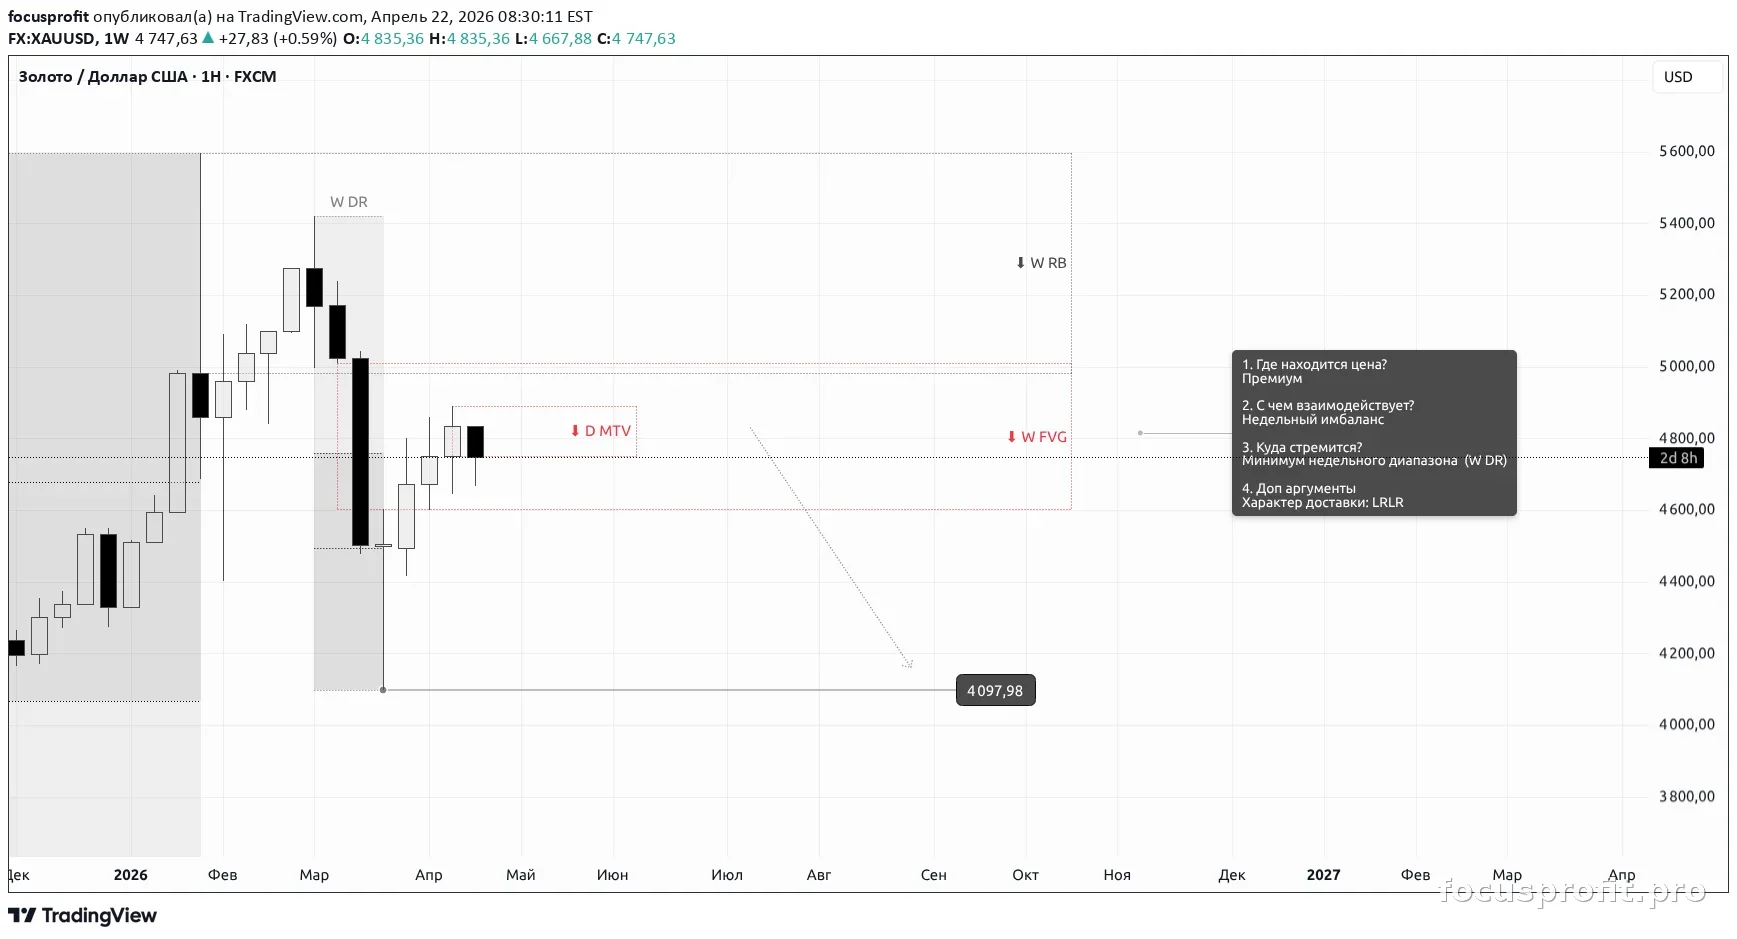
Key Levels
| Level | Value |
|---|---|
| Point A (invalidation) | 4890.67 |
| Target B | 4097.98 |
The focus is a bearish impulse towards the low of the weekly dealing range.
Higher-Timeframe Context
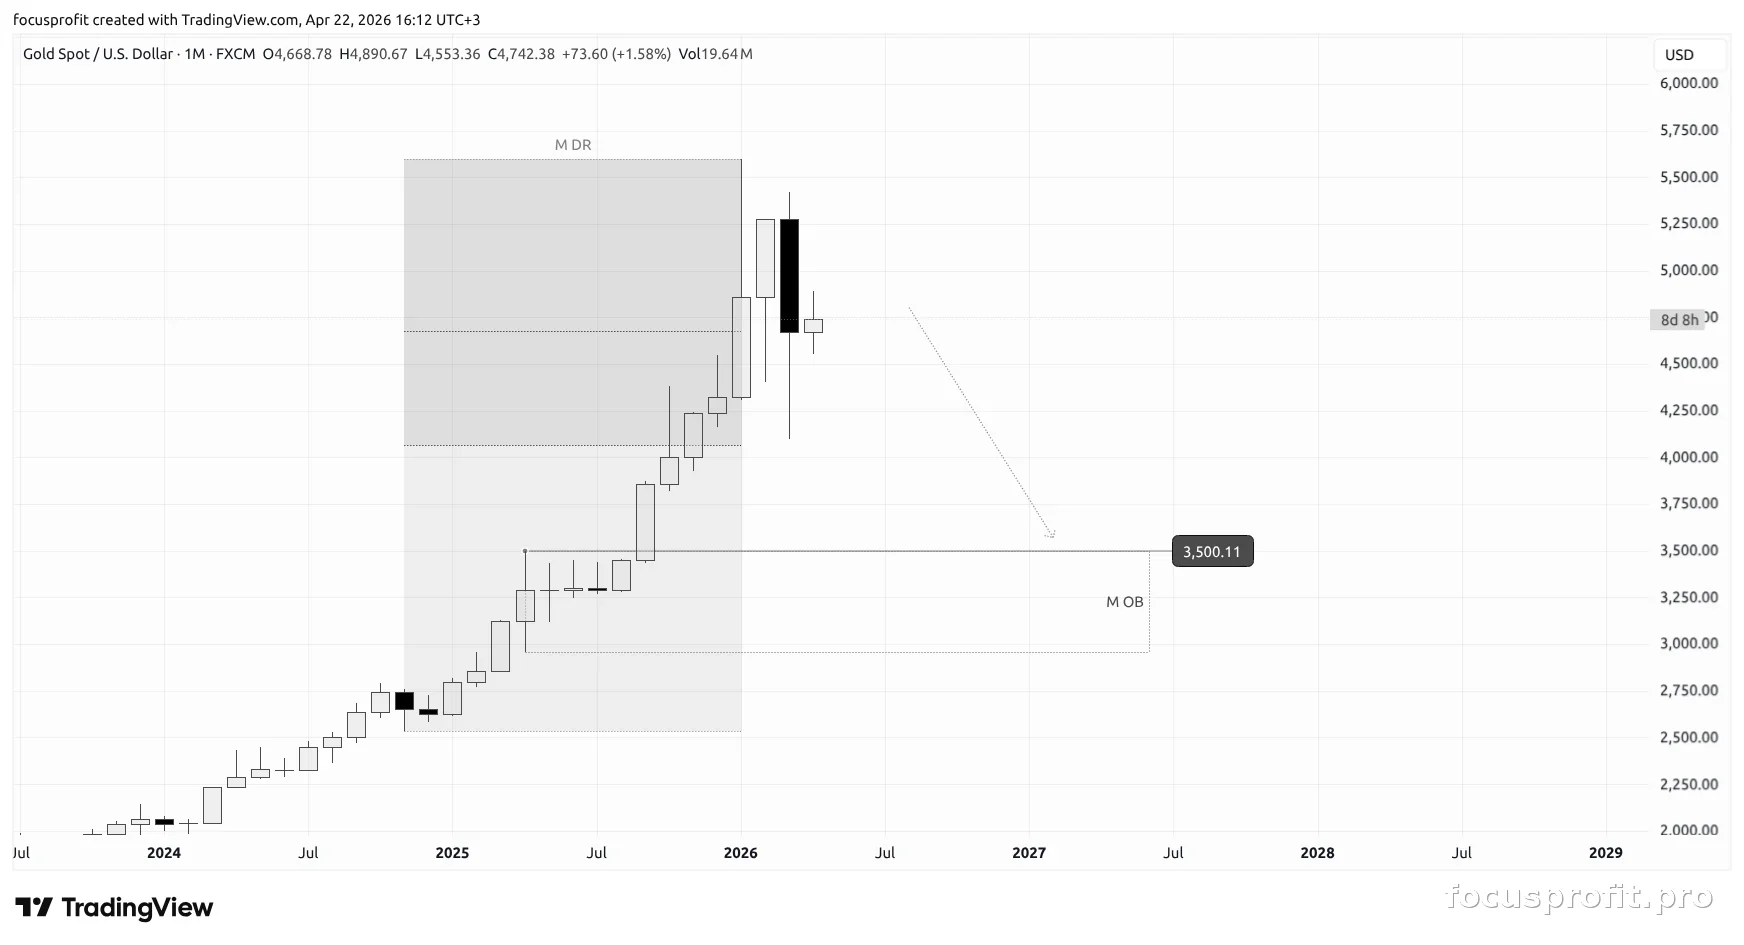
Higher-timeframe context
- Higher context: short
- Targets reached: the monthly dealing range (M DR) is formed
- Next targets: a correction into the discount zone of the monthly dealing range (M DR)
Market phase
- Market phase: trend
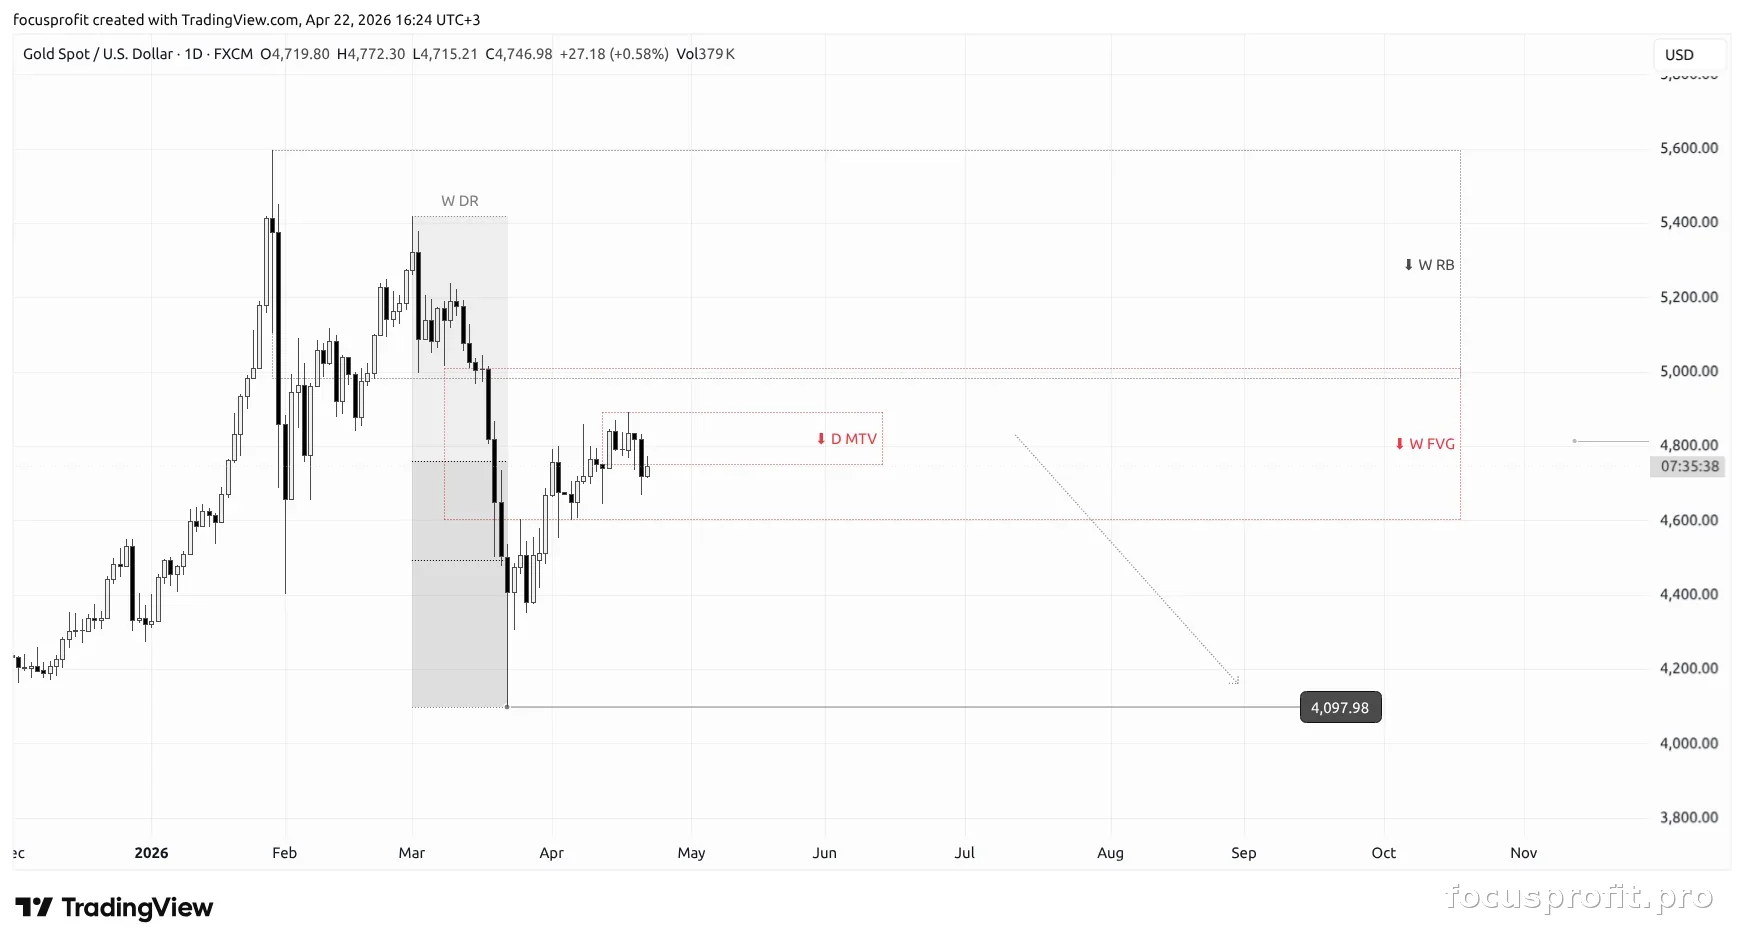
- Basis: a reaction taken from the weekly reaction block (W RB → W FVG)
- Scenario: short towards the monthly fractal
Execution Context
Price position and interaction
- Price position: premium of the weekly dealing range (W DR)
- Interaction: W FVG
- Additional factors: D MTV and the character of price delivery (LRLR)
Priority and target
- Priority: short
- Nearest target: the low of the weekly dealing range (W DR)
Invalidation
While price stays below the high of the weekly dealing range (W DR), the bearish scenario remains valid.
Outcome
completed
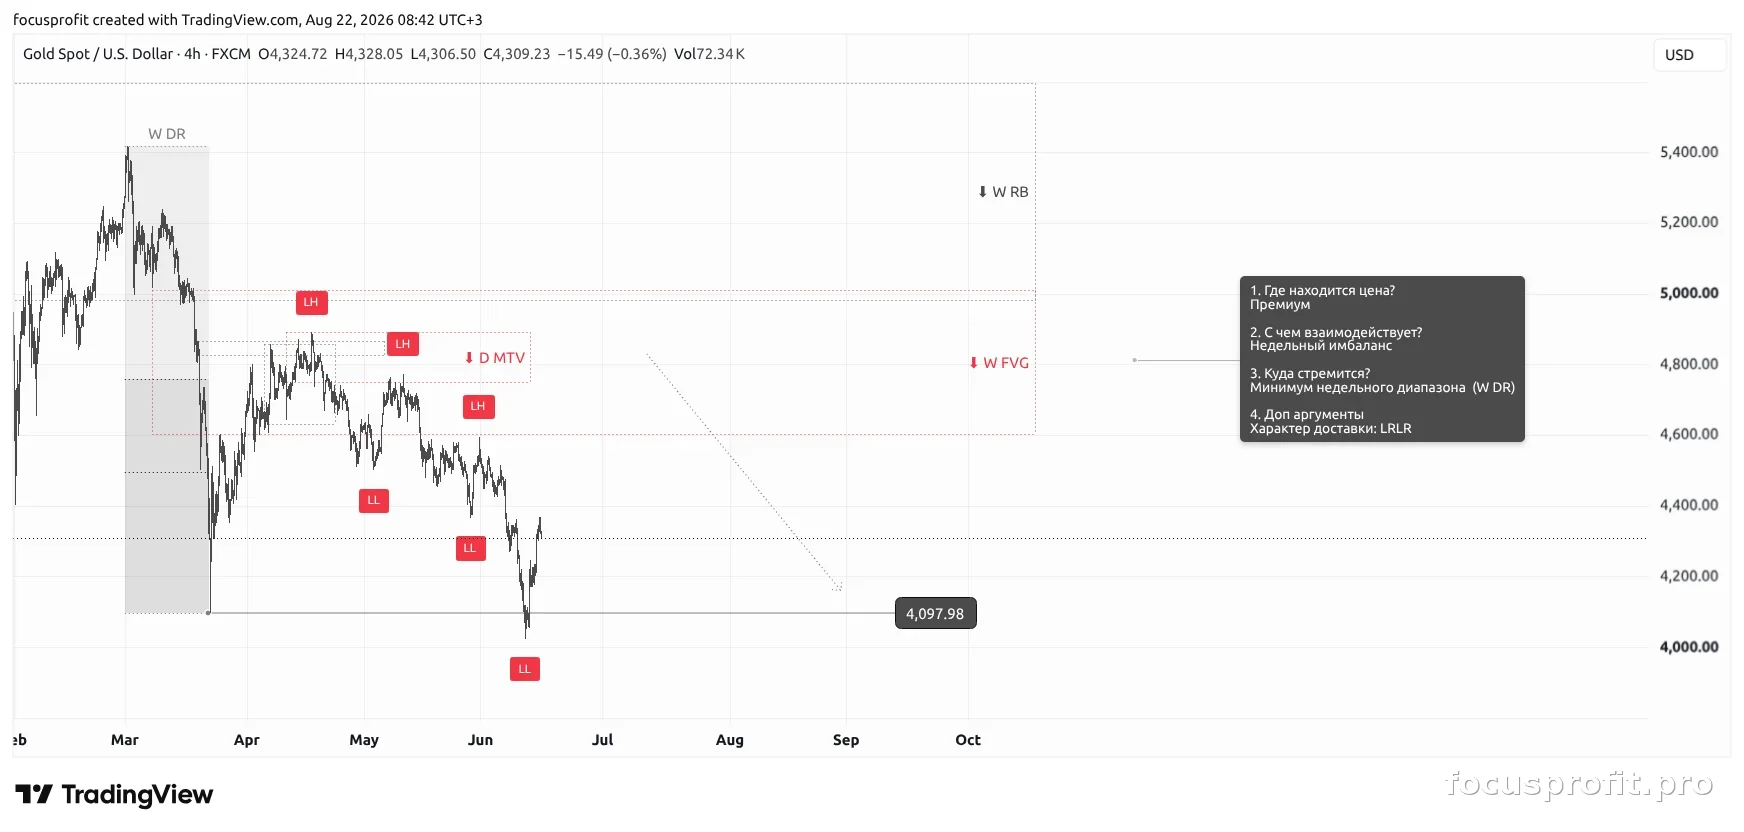
The boundaries of these ranges can be checked for free: they are built from the extremes of the structure, and the extremes are drawn by our open indicator Focusprofit. Market Structure — published in the TradingView library, one click to add, no invite needed. Open the same data and build the boundaries yourself. The rest of the markup on the chart — order flow, imbalances, MTF — is added by the closed Trade Model.
Open in TradingView →4H Ranges
Ranges: 2 · worked out: 2 · did not: 0
| Formed | Boundaries | Outcome | Check |
|---|---|---|---|
| 2026-05-04 | 4500.45 – 4890.67 | WIN | after formation price went below the lower boundary — down to 4365.85 (28.05); the upper 4890.67 held, the high in between was 4773.54 |
| 2026-05-28 | 4365.85 – 4773.54 | WIN | price went down to 4023.64 (11.06) — below the lower boundary; the upper 4773.54 held, the high was 4595.32 |
Your thoughts?
Which scenario do you see on gold: a continuation lower towards the low of the weekly range, or a return above its high?
This is not investment advice. Analytical market structure overview.
Related
SYSTEMATIC WORK WITH THE MARKET
This material is open: no application, nothing to pay. There is one paid product — the Trade Model indicator, and it is not on sale right now: we are taking signups for the queue.
JOIN THE QUEUE