Liquidity in plain words — and how to check it yourself
Liquidity is not big players' money and not trading volume. It is other traders' stop orders, and they sit exactly where everything looks obvious.
Where stop orders sit and how it works
We start without charts — with selling a car. Then: why orders pile up behind obvious levels, a live example on gold — and an example where the same thing did not work.
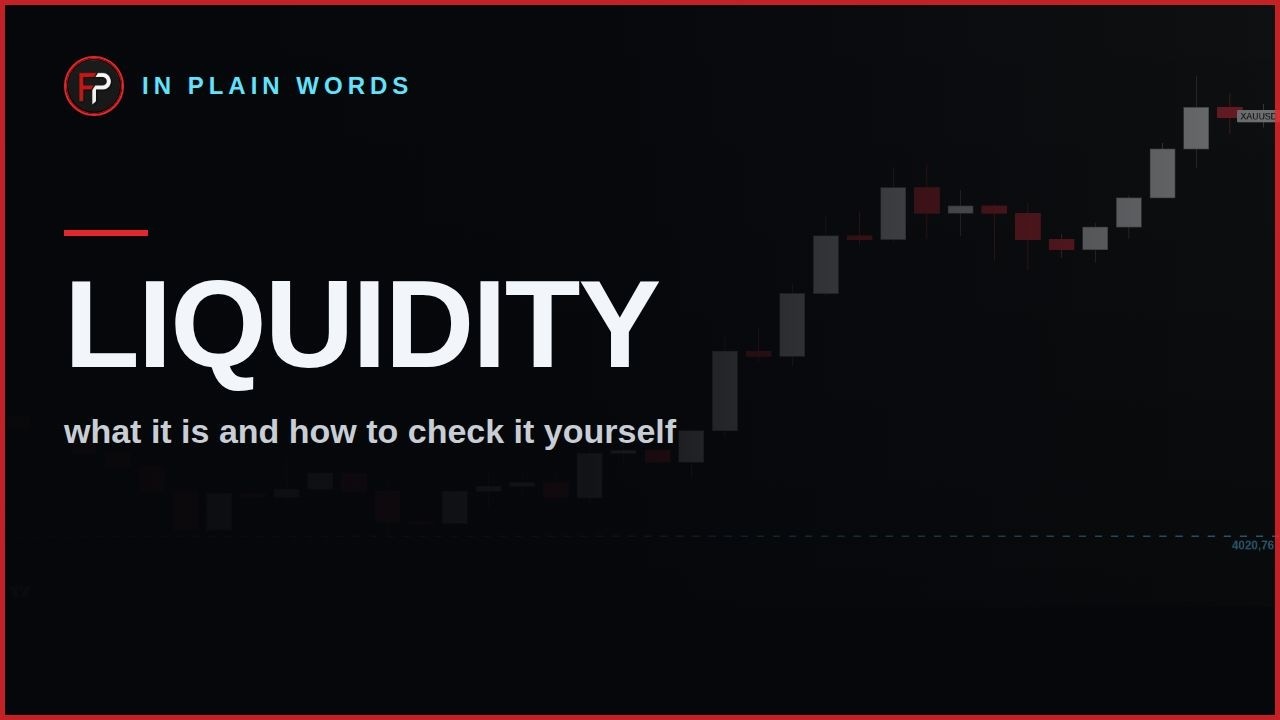
Where liquidity starts
Start without charts — with selling a car. If you have a month, you sell at market price. If you need it today, you cut the price. Price moves exactly as far as it must for the other side to appear. The market works the same way.
Why do orders pile up behind obvious levels? Because that is where everyone puts their stops. An obvious low is an obvious stop location for buyers. Price dips under the level, collects those orders, and moves on.
A live example: XAUUSD, 4-hour
July 31 — two nearly equal lows: 4021.92 and 4020.76. August 3 — a low of 4019.03: 1.73 below the level. August 7 — a high of 4371.73: plus 352.70 from that low.
The counter-example — more important than the example
On July 28 there was the same kind of obvious low at 4019.28 — and price simply went lower, to 3995.83. Stepping under a level guarantees nothing by itself. Everything shown in the video can be reproduced: the markup comes from the free script, not the private one.
How this fits the FocusProfit model
Liquidity is the base layer of the methodology. The FocusProfit Trade Model indicator marks swings and ranges to show where orders sit — but the indicator does not replace understanding the logic.
The next lesson in the course is the swing: how to count the obvious extreme those orders sit behind, and why some of those points matter more than others.
Related lessons
SYSTEMATIC WORK WITH THE MARKET
This material is open: no application, nothing to pay. There is one paid product — the Trade Model indicator, and it is not on sale right now: we are taking signups for the queue.
JOIN THE QUEUE