Zone outcome statistics
Measured on 31 July 2026. Data: 6 instruments, the hourly timeframe, 1 January – 15 July 2026. Dataset v1.
How we measure
The indicator marks zones of interest on the chart — areas where market structure suggests price may react. To improve zone detection by numbers rather than by eye, we built a measurement baseline.
The schemes below illustrate the method, not trades: they deliberately show no entries, stops or targets.
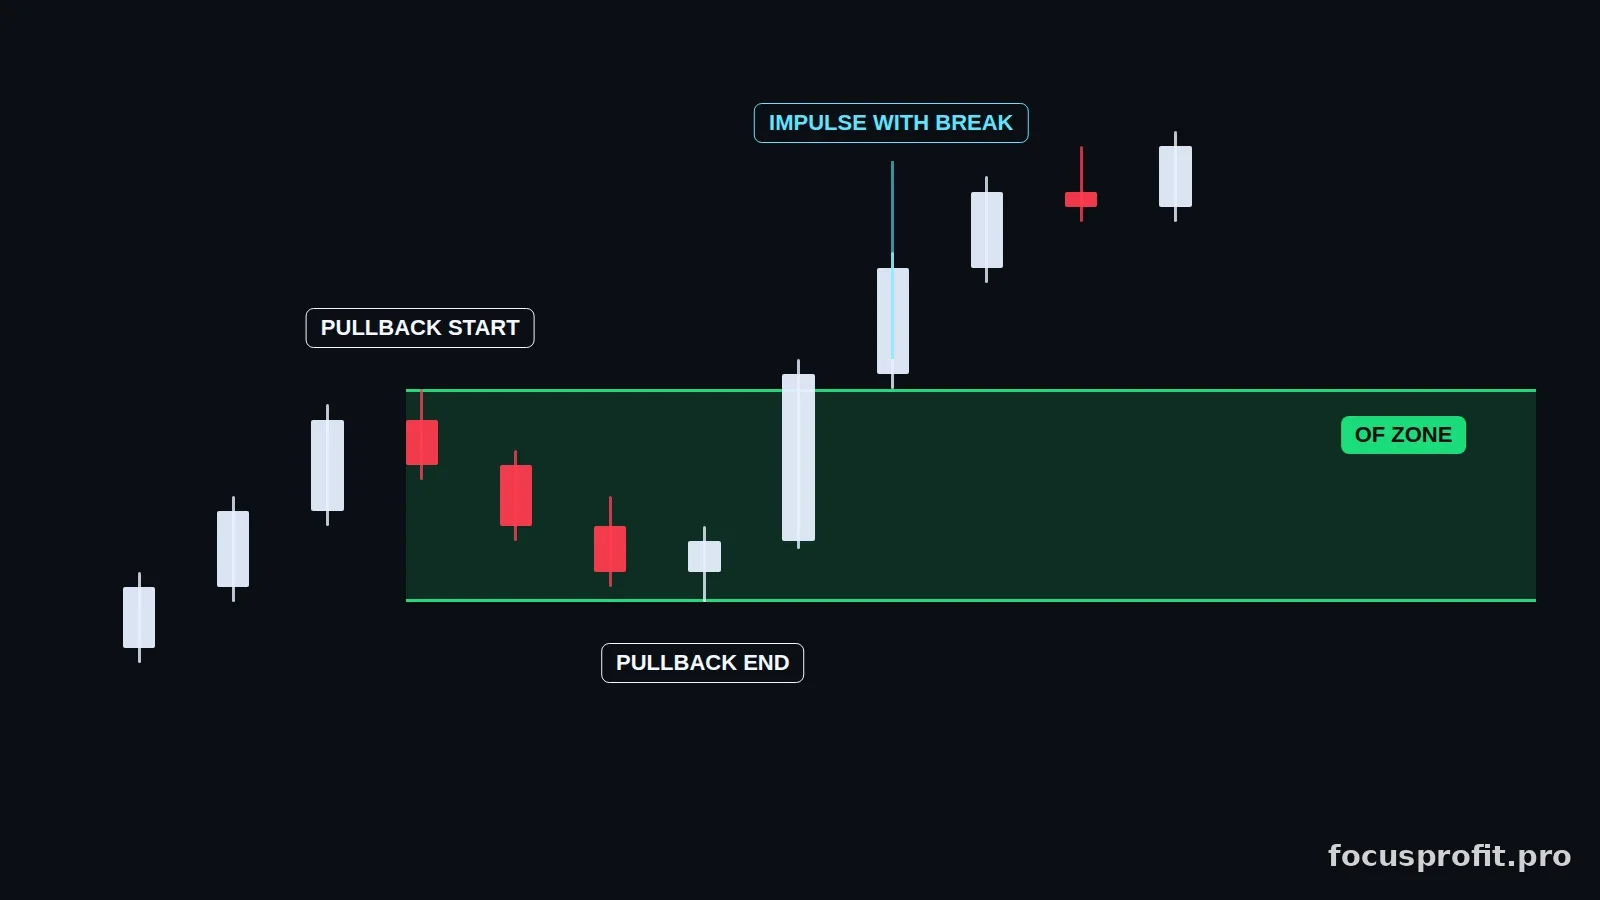
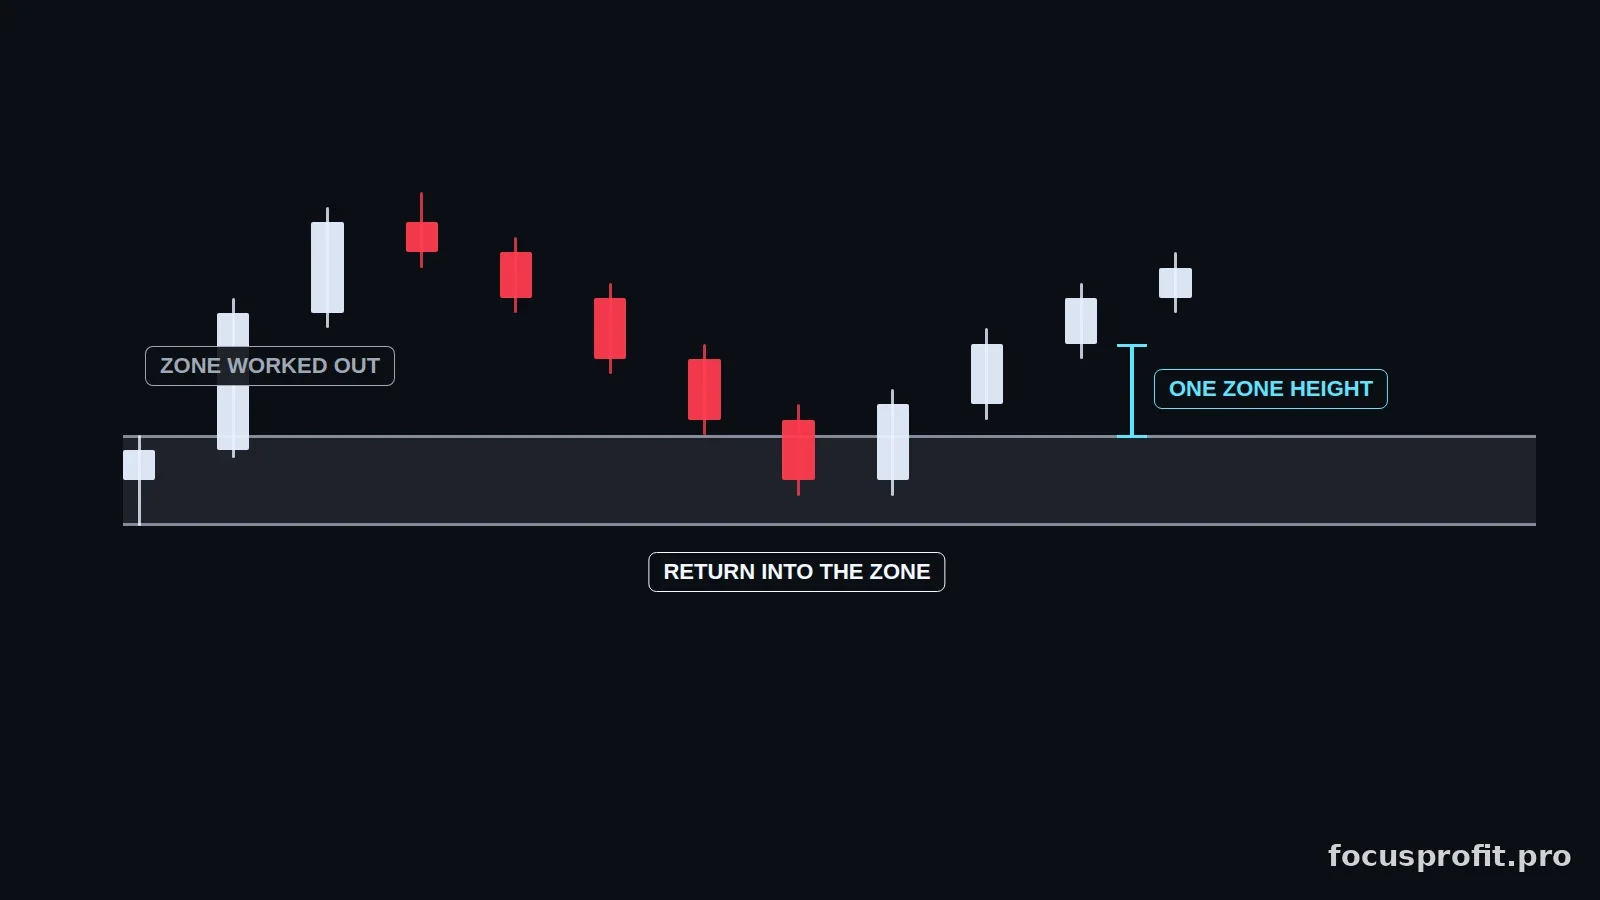
What counts as a worked zone. A zone has worked if, after the first touch, price travelled at least one zone height in the zone’s direction before the zone was broken. One zone height is a conservative reading of “the move covered the risk”. We also record the full ladder of thresholds: half a height, one, two, three.
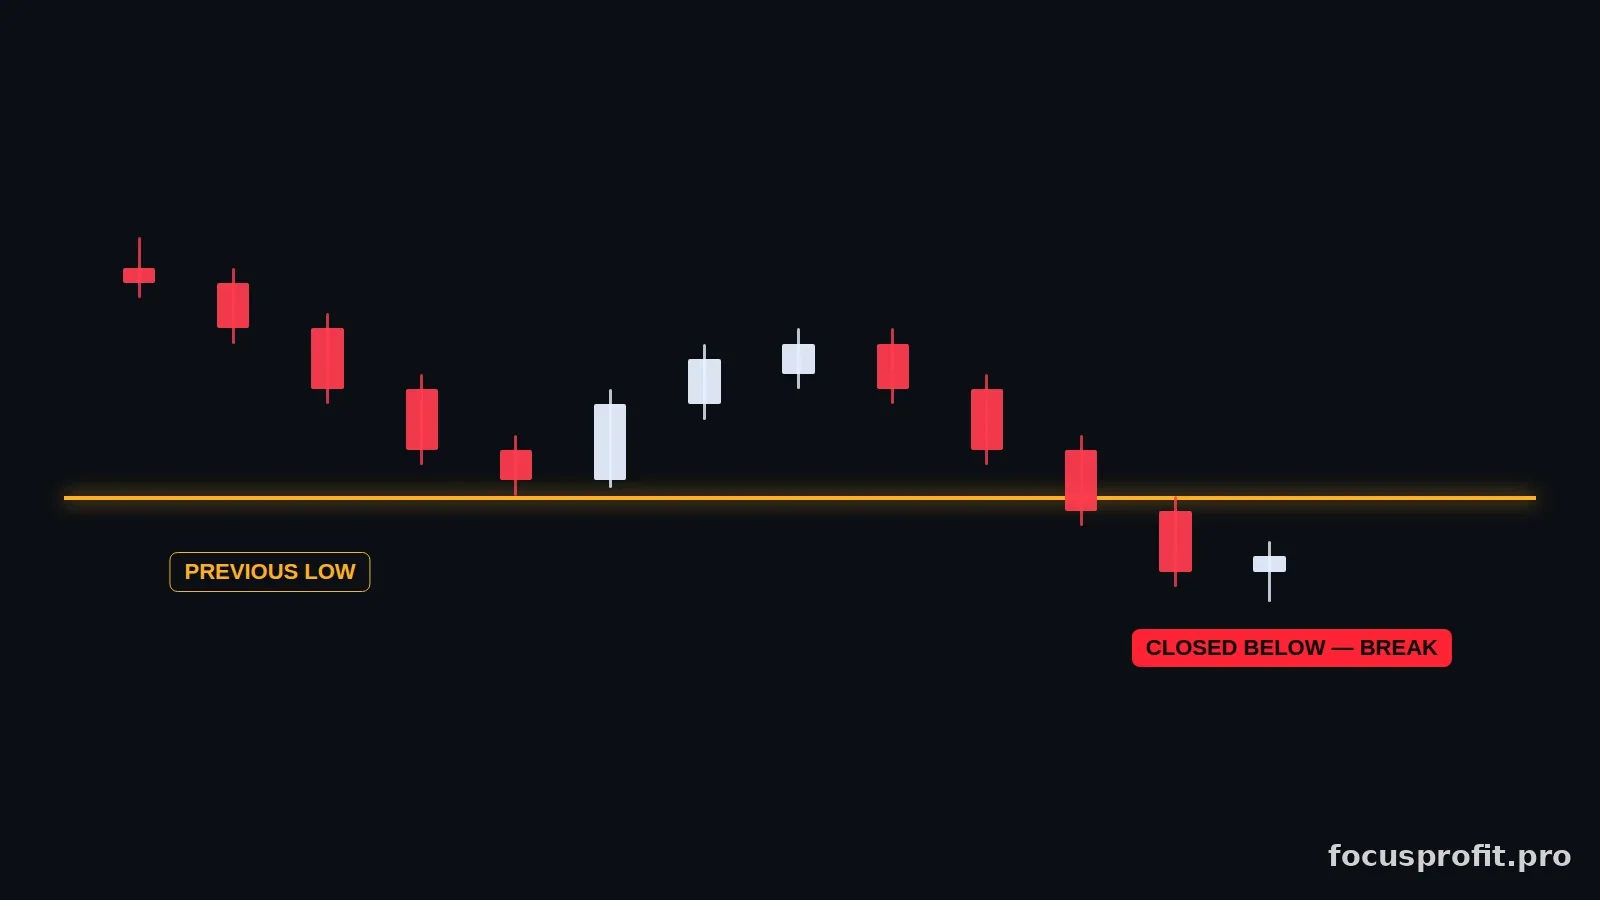
When an observation is closed. The observation window closes when a candle closes beyond the zone’s far boundary, or when the trend reverses. Zones whose window was still open at the end of the period are excluded from the ratio and shown on a separate line.
On what data. A fixed set: 6 instruments (EURUSD, GBPUSD, USDJPY, AUDUSD, gold XAUUSD and BTC/USDT), the hourly timeframe, 1 January – 15 July 2026. The dataset is pinned in the repository: any recalculation reproduces the same numbers exactly.
Fair comparison. Every future change to zone detection is compared against this baseline, on the same metric and the same data — before and after. We publish it as it is: strong slices and weak ones alike, with the sample size on every line.
Current numbers
Snapshot: dataset v1, 1 Jan – 15 Jul 2026
Zones in the sample — 353. Price returned to the zone in 74 % of cases (262 of 353); in 26 % the zone was never touched. Closed observations — 240.
Share of zones that worked (move ≥ 1 zone height before the break): 60.8 % (146 of 240).
Ladder of thresholds, share of closed observations (closed observations in total — 240):
| Move threshold | Share of 240 closed observations |
|---|---|
| ≥ 0.5 zone height | 76.2 % |
| ≥ 1 zone height | 60.8 % |
| ≥ 2 zone heights | 39.2 % |
| ≥ 3 zone heights | 27.1 % |
Median move from the zone to its break — 1.31 zone heights.
The most contrasting slices:
| Slice | Share that worked (≥ 1 height) | Sample |
|---|---|---|
| Zones left with a strong impulse after forming | 78.2 % | 101 |
| Zones followed by a break of structure | 65.6 % | 96 |
| Zones tested by the bottom of a completed pullback | 62.9 % | 186 |
| Zones with no break of structure after them | 57.6 % | 144 |
| Whole baseline (for comparison) | 60.8 % | 240 |
Check it yourself
Only market structure takes part in defining the markup — the sequence of highs and lows (HH, HL, LH, LL). Nothing else goes into it.
That structure is visible for free. Our open indicator Focusprofit. Market Structure is published in the TradingView library: one click to add, no invite needed. Open the same data — 6 instruments (EURUSD, GBPUSD, USDJPY, AUDUSD, gold XAUUSD and BTC/USDT), the hourly timeframe, 1 January – 15 July 2026 — and you will see the same structure markup the measurement is built on.
The open version draws the structure but does not mark the zones and does not compute the statistics — that is the full Trade Model. What you can check is what the markup is derived from: the structure itself.
When it is updated
The numbers are recalculated on the same dataset with every release that affects zone detection. Latest measurement — 31 July 2026.
Disclaimer
All statistics on this page are historical: they describe how price behaved on a specific set of instruments over a specific past period and do not guarantee future results. This material is not individual investment advice; trading decisions and risks are the user’s own.
Separately from this page we keep monthly reports on published trade plans and ranges. That is a different subject of measurement — published analytics tracked cohort-style by the month a range formed — and different numbers. Percentages from the two measurements cannot be added or compared: this page measures how price behaved around zones on a fixed dataset; the reports track the fate of specific published ranges. The English reports archive is in preparation.