NAS100 — there was no strength in that zone, and the target was taken anyway
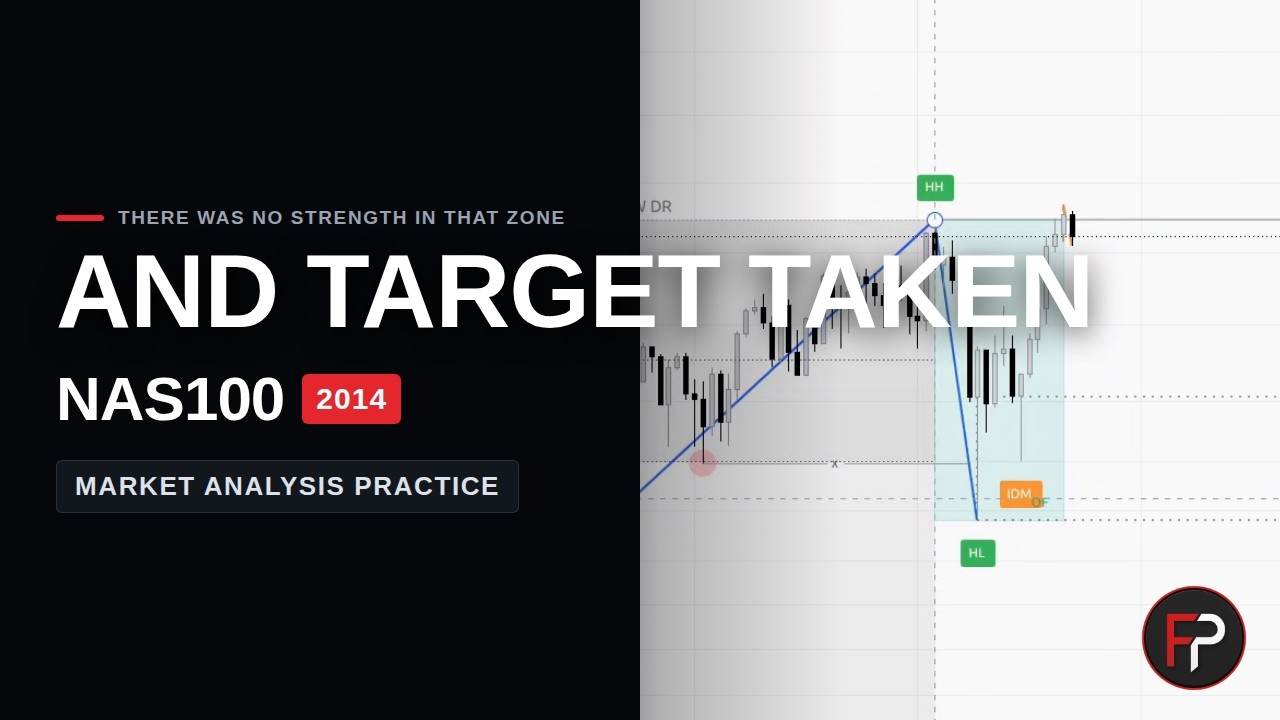
An episode about honest markup. The plan leaned on an order flow with no strength in it — and that was said out loud BEFORE the resolution, together with the fallback zone. The criterion was met by another element: the weekly reaction zone after the liquidity sweep. The target is the established high of the weekly range, 4,691.0. The level was taken.
Watch the breakdown
We take a random bar in history, define the narrative, and read the market live — no scripts, just structure and facts.
Step by step
1. Practice continues. Today it is the NAS100 index, the timeframe is weekly. A random bar in history brings us to two thousand fourteen.
2. The first thing to define is the trend. The index mostly rises, but «mostly» is not markup. To confirm the trend we need the last two trade ranges. We mark the first one — here it is. And the second one below: its edge starts roughly from this point. We mark both.
3. The corrections back into the ranges stayed shallow: price left upwards quickly. That is how a living buyer flow moves.
4. The first range is already spent — there are no ideas in it. No idea is a conclusion too, not a pause before one. We wait for a new range and work inside that one.
5. Inside the new range price moved in compression — squeezed into a narrow corridor, and then took that compression out. It came into the discount zone of its own range and took the liquidity there.
6. The liquidity here is weekly, and that matters: the reaction is measured from it. The closing candle forms a weekly reaction zone — the place price bounced from, rejecting a lower price. On the chart that zone is labelled. A candle like this already hints at buyer dominance.
7. From here the frame of the plan is built: a move from the weekly reaction zone to the established high of the range.
8. Now three questions. Where is price? In the discount zone of the weekly trade range — we write that down on the chart. What is it interacting with? A weekly fractal that gave a reaction in the form of a weekly reaction zone. Where is it heading? To the high of the weekly trade range — four thousand six hundred ninety one. The plan is formed.
9. Now we check ourselves with the indicator. We turn on Trade Model — our own development, the link is in the description and in the pinned comment. It builds market structure and marks out the trade ranges.
10. The range of the indicator came out slightly wider, and the intermediate range is not there at all. The read is corrected quickly — by the logic of market structure, not by wish. What matters here: the manual trade ranges match the markup of the indicator. The direction panel confirms it: weekly and monthly are long, the daily has no value.
11. Next we turn the imbalance on and look at the order flows. Usually the eye does not see them — the indicator draws them, and every flow carries its own rank of strength. And here is the honest part of the breakdown: price came into an order flow, but there is no strength in it. A stronger flow lies below. So there is a chance this zone will not hold price, and I say it now, before the resolution, not after.
12. But the confirmation comes from another element: a weekly reaction zone after the liquidity was taken. The liquidity itself sat on the order flow, and price sat in the discount zone. The criterion is met.
13. The logical target is the established high: it closes the range. If this zone does not hold, the next one lies below, in that same order flow.
14. The idea is taken because it fits every parameter: the buyer dominates, the trend is alive and healthy, the conditions are met. No promise of a result and no entry points — only a match with the criterion, said out loud.
15. Let us look at how the events developed. Price gave the confirmation with the weekly reaction zone and carried on. The level is taken.
The weak spot is named before the resolution, not after
Price came into an order flow with no strength in it — and that was said before the resolution, together with the fallback zone below. The criterion was met by another element: the weekly reaction zone after the liquidity sweep. The plan worked not because the weak spot turned out strong, but because it did not lean on that spot alone.
Order flows and their strength rank are drawn by the FocusProfit Trade Model indicator — the eye does not see them. See the broader framework in the methodology section, why the point of being wrong matters more than the point of profit in why «where am I wrong» matters more than «where do I profit», and more episodes in market analysis practice.
Related
SYSTEMATIC WORK WITH THE MARKET
This material is open: no application, nothing to pay. There is one paid product — the Trade Model indicator, and it is not on sale right now: we are taking signups for the queue.
JOIN THE QUEUE