Chart-reading quiz: EURUSD 4H
Price pulls back from the high. Two liquidity zones sit below, and the bigger one looks like the obvious target. But the real target of the move is deeper. Read the chart and find where the pullback is heading.
What do you see?
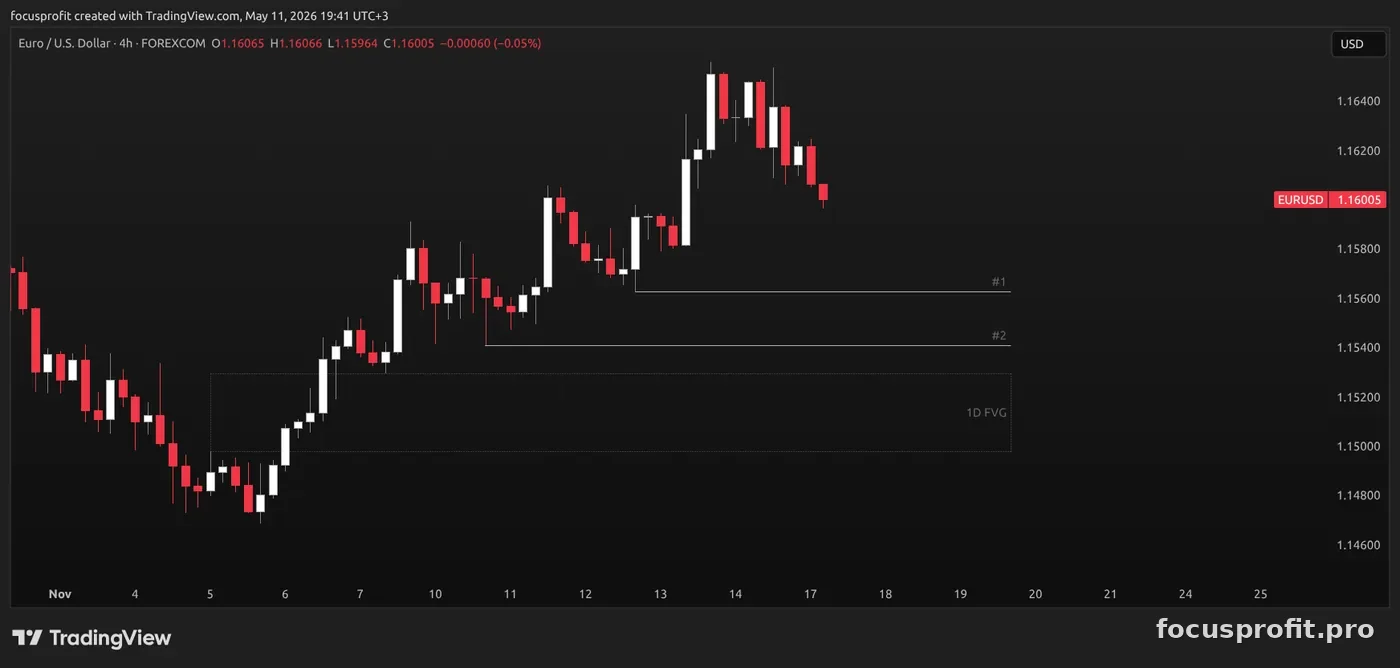
Price pulls back from the high. Below you can see two liquidity zones (#1 and #2) and an unfilled daily FVG. Where is the real target of this pullback?
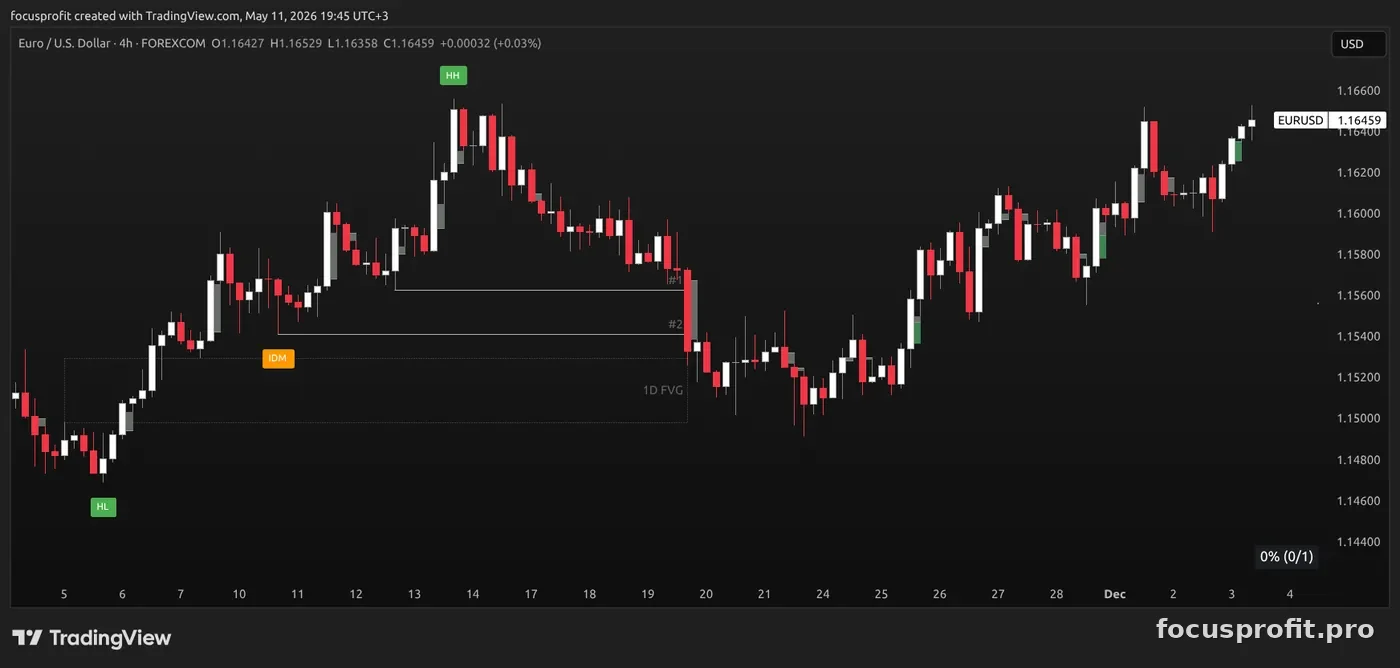
Correct answer: Into the 1D FVG — the unfilled imbalance below
Where the pullback is really heading
The case: EURUSD, 4H, a fresh situation. Price pulls back from the high. At first glance there are two obvious targets below (#1 and #2). But the real liquidity is deeper.
- #1 — surface liquidity. Equal lows, fresh stops of those who went long. It will almost certainly be taken, but it is an intermediate stop, not the target.
- #2 is the IDM — that is, a trap. The indicator highlights the IDM only where liquidity has already been swept before. Behind the level there is no "large pool of stops" but a lure that looks like a target. Most will pick exactly it, because "bigger = more important". That is the essence of the trap.
- The real target is the 1D FVG. The unfilled daily imbalance is the zone the whole structure above exists for. The IDM at #2 is the hint that price is heading deeper.
Logic: liquidity #1 → IDM trap (#2) → the real target in the 1D FVG. In the moment price can turn from any level — that is the market. But the hierarchy of targets is this: the deeper the zone, the higher its priority if an IDM stands above it.
Build the read
The structure read behind this quiz is explained term by term in the Learn section — start with market structure and the multi-timeframe approach. See it applied to live instruments in the market reviews.
SYSTEMATIC WORK WITH THE MARKET
Analysis, ranges, structure — inside the FocusProfit Club private Telegram group.
APPLY FOR ACCESS