Chart-reading quiz: USDJPY 4H — find the mistake
The trend is up, the pullback looks like an entry, the stop is tight, the target is the HH. The setup reads clean — and that is exactly how money is lost. Read the chart and find the mistake.
What do you see?
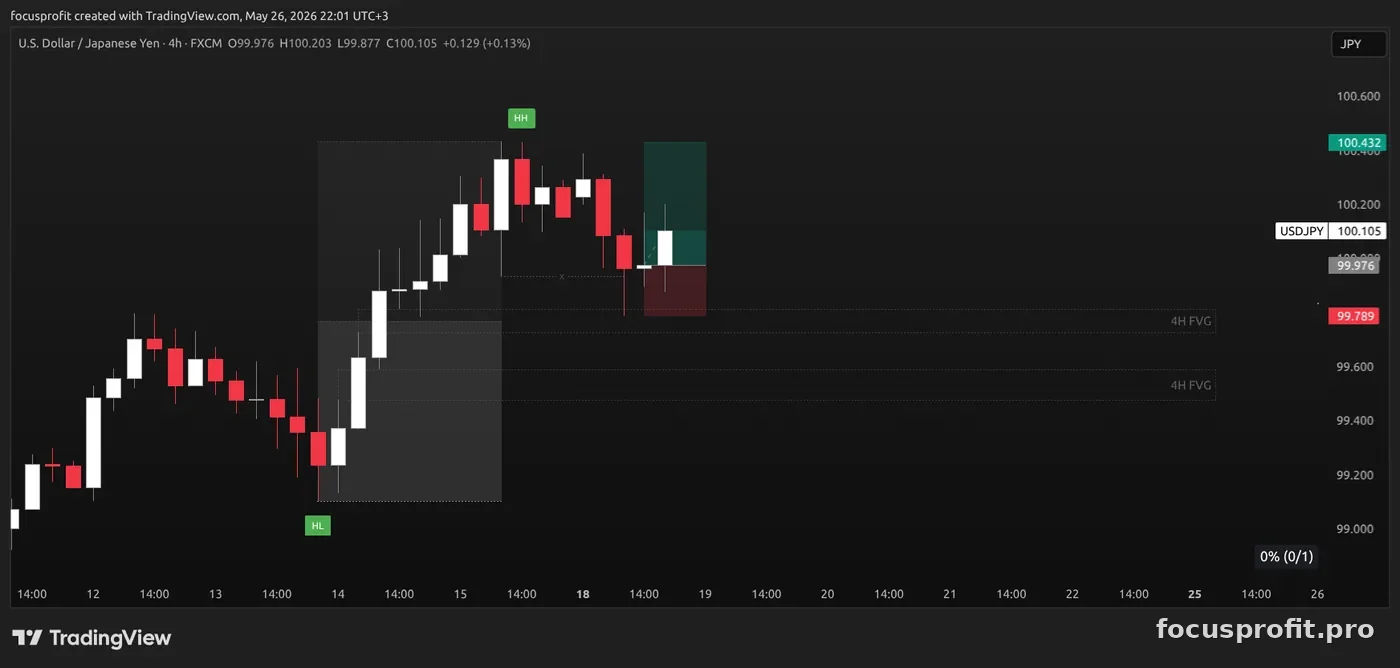
Price made an HL, gave a strong impulse to a new HH and started a pullback. The trader goes LONG from the current price: stop below the entry, take up to the HH. Find the mistake in the setup:
Correct answer: The entry is in the upper zone — the real target of the pullback is deeper
Why the entry is the mistake
The case: USDJPY, 4H, a fresh situation. The setup looks logical — uptrend, pullback, entry "off the level", compact stop, target the HH. But this is exactly how those who see only the structure and miss the trap lose money. The direction is right; the entry point is not.
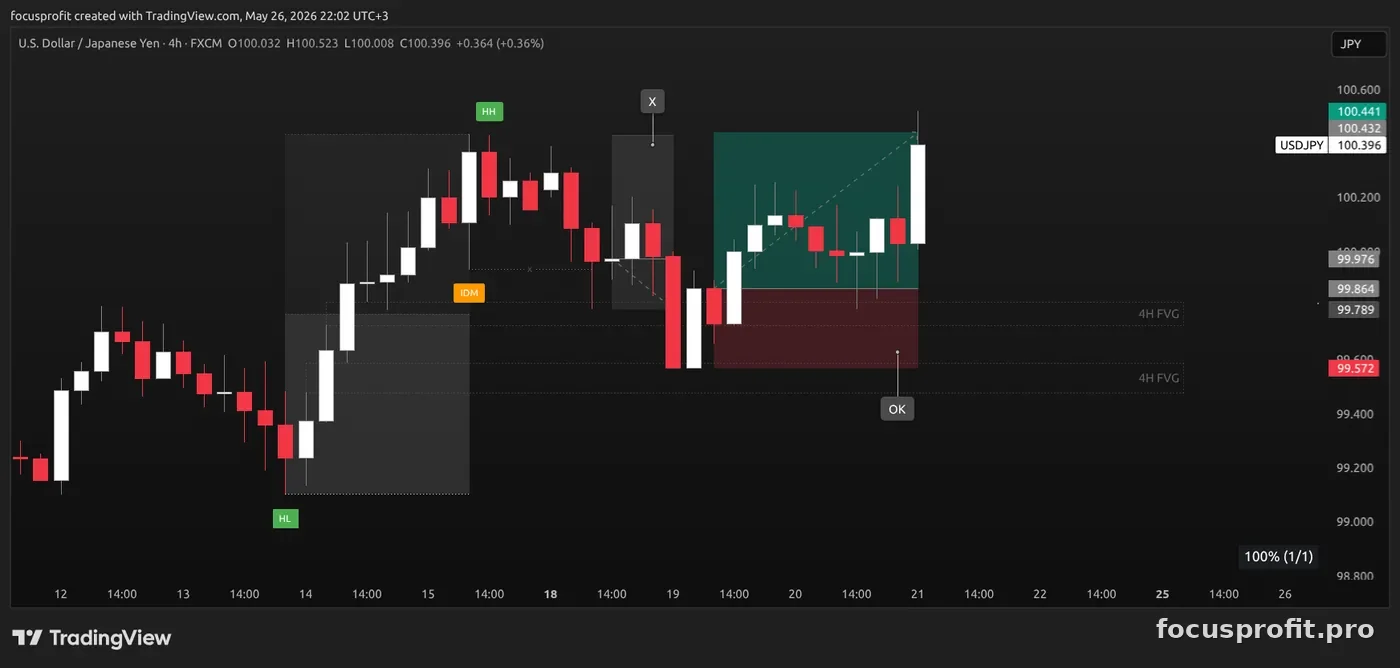
- The entry landed inside the IDM. The indicator highlights the IDM exactly where a beginner sees an "entry zone". That is not a buyer's zone — it is a trap with real liquidity resting under it. Price was bound to take it out.
- The real target of the pullback is the lower 4H FVG in discount. The LONG context does not cancel the fact that the pullback has to reach the zone where the buy is justified. The upper imbalance is premium inside the last move; buying there is trading against your own logic.
- The direction was right, the entry point was not. The setup closed at a loss even though two days later price went on to a new HH. The most painful mistake is to read the market correctly and lose on the wrong entry point.
Logic: LONG context → pullback into discount → entry after the IDM, not before. The IDM exists exactly for setups like this. The indicator shows it in advance — the trader's job is to see the hint.
Build the read
The structure read behind this quiz is explained term by term in the Learn section — start with market structure and the multi-timeframe approach. See it applied to live instruments in the market reviews.
SYSTEMATIC WORK WITH THE MARKET
Analysis, ranges, structure — inside the FocusProfit Club private Telegram group.
APPLY FOR ACCESS